All Features

Anthony Chirico
Everybody wants to design and conduct a great experiment! To find enlightenment by the discovery of the big red X and perhaps a few smaller pink x’s along the way. Thoughtful selection of the best experiment factors, the right levels, the most efficient design, the best plan for randomization, and…

Jody Muelaner
In this article I will show that the conventional method for calculating uncertainty is not always reliable. In fact, it is generally only exact when the measurement can be represented by a simple linear equation and the input uncertainties are all normally distributed. Whenever the measurement is…

Scott A. Hindle
Walter Shewhart, father of statistical process control and creator of the control chart, put a premium on the time order sequence of data. Since many statistics and graphs are unaffected by this, you might wonder what the fuss is about. Read on to see why.
Figure 1 shows a series of measurements…

Minitab LLC
Machine learning as a tool in your analytical toolkit can help accelerate the discovery of insights in data that can create a more efficient manufacturing process and drive innovation.
Machine learning in the spotlight
The growth in availability of technologies that give us the ability to monitor,…

Donald J. Wheeler
Process behavior charts are the interface between your data and your brain. But you have to begin by making a choice about which type of chart to use. You can either plot the individual values themselves, or you can organize your data into rational subgroups and plot the subgroup averages. This…

Minitab LLC
Process validation is vital to the success of companies that manufacture pharmaceutical drugs, vaccines, test kits, and a variety of other biological products for people and animals. According to FDA guidelines, process validation is “the collection and evaluation of data, from the process design…
David Currie
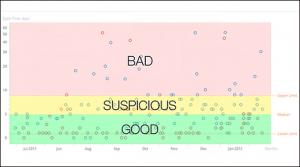
This is the second article in a three-part series to help readers distinguish good metrics from bad. In part one we discussed good metrics. Here, we will look at a bad metric and consider how to change it into a useful, good metric. A bad metric is one that fails in one or more of the attributes of…

Donald J. Wheeler
In Part One and Part Two of this series we discovered some caveats of data snooping. In Part Three we discovered how listening to the voice of the process differs from the model-based approach and how it also provides a way to understand when our models do and do not work. Here we conclude the…

Anthony Chirico
Perhaps the reader recognizes d2 as slang for “designated driver,” but quality professionals will recognize it as a control chart constant used to estimate short-term variation of a process. The basic formula shown below is widely used in control charting for estimating the short-term variation…

Minitab LLC
Choosing the correct linear regression model can be difficult. Trying to model it with only a sample doesn’t make it any easier. Let’s review some common statistical methods for selecting models, complications you may face, and look at some practical advice for choosing the best regression model.…

Dirk Dusharme
In this episode we look at a history of quality, how you serve your customer in the housing industry, and what makes a good review.
“Young couples ‘trapped in car dependency’”
Building entry-level housing along highways may give couples the chance to buy a home, but at what cost to them and the…
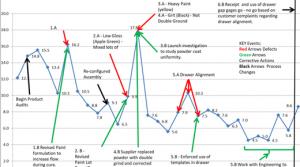
David Currie
Metrics are an important part of an effective quality management system (QMS). They are necessary to understand, validate, and course-correct the QMS. They should be used to verify that it is achieving the goals and objectives defined by management. In an ISO 9001 system, metrics must be available…

Dirk Dusharme
In this episode we look at data, data, more data, and then... engineering the perfect human?
“Your Data Are Your Most Valuable Assets”
Just what the heck is Quality 4.0? Remember this acronym: CIA. No, not that CIA. Nicole Radziwill explains.
“Applying Smart Manufacturing Technology to Conduct…

Anthony Chirico
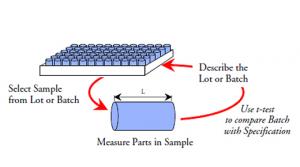
In my first article, the merits and cautions of AS9138 c=0 sampling plans were discussed and a simple formula was provided to determine the required sample size to detect nonconforming units. In the second article, the process control properties of MIL-STD-105 c>0 sampling plans were…

Anthony Chirico
In my previous article, I discussed the merits and cautions of the “acceptance number” equal zero (c=0) sampling plans contained within AS9138. A simple formula was provided to determine appropriate sample size, and it was illustrated that twice the inspection does not provide twice the consumer…

Anthony Chirico
Aerospace standard AS9138—“Quality management systems statistical product acceptance requirements” was issued this year (2018), a few years after its accompanying guidance materials in section 3.7 of the International Aerospace Quality Group’s (IAQG) Supply Chain Management Handbook. The new…

Dirk Dusharme
In this all-manufacturing episode, we look at the STEM pipeline into manufacturing, supplier development, how to make sense of manufacturing data and, no, manufacturing is not dead.
“Strengthening the STEM Workforce Pipeline Through Outreach”
NIST does more than just research and come up with…

Donald J. Wheeler
Parts One and Two of this series illustrated four problems with using a model-building approach when data snooping. This column will present an alternative approach for data snooping that is of proven utility. This approach is completely empirical and works with all types of data.
The model-…

Davis Balestracci
During the early 1990s, I was president of the Twin Cities Deming Forum. I had a wonderful board whose members were full of great ideas. One member, Doug Augustine, was a 71-year-old retired Lutheran minister and our respected, self-appointed provocateur. He never missed an opportunity to…

Laurel Thoennes @ QD
In the foreword of Mark Graban’s book, Measures of Success: React Less, Lead Better, Improve More (Constancy Inc., 2018), renowned statistician, Donald J. Wheeler, writes about Graban: “He has created a guide for using and understanding the data that surround us every day.
“These numbers are…

Rip Stauffer
I must admit, right up front, that this is not a totally unbiased review. I first became aware of Davis Balestracci in 1998, when I received the American Society for Quality (ASQ) Statistics Division Special Publication, Data “Sanity”: Statistical Thinking Applied to Everyday Data. At the time, I…

Donald J. Wheeler
In “Data Snooping Part 1” (Quality Digest, Aug. 6, 2018) we discovered the basis for the first caveat of data snooping. Here we discover three additional caveats of data snooping.
Last month we discovered:
Here we will use the data set from Part One to illustrate three additional caveats. The…

Donald J. Wheeler
Data mining is the foundation for the current fad of “big data.” Today’s software makes it possible to look for all kinds of relationships among the variables contained in a database. But owning a pick and shovel will not do you much good if you do not know the difference between gold and iron…

William A. Levinson
Quality and manufacturing practitioners are most familiar with the effect of variation on product quality, and this is still the focus of the quality management and Six Sigma bodies of knowledge. Other forms of variation are, however, equally important—in terms of their ability to cause what…
Donald J. Wheeler
The ultimate purpose for collecting data is to take action. In some cases the action taken will depend upon a description of what is at hand. In others the action taken will depend upon a prediction of what will be. The use of data in support of these two types of action will require different…