All Features

Douglas C. Fair
A few months back, I was reading a really good article from The Wall Street Journal, titled “Stop Using Excel, Finance Chiefs Tell Staffs.” Even though it was geared toward accounting and corporate operations, the message of the article struck home: Excel shouldn’t be used as an enterprisewide…

NACS
The phrase, “Are we there yet?” has long been associated with boring summer road trips. However, a new study shatters that myth, as it shows that 69 percent of people say traveling to their destination is often as fun as the actual vacation destination. The Summer Drive Study by the NACS, a trade…
Harish Jose
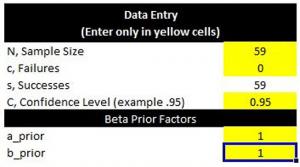
I have written about sample size calculations many times before. One of the most common questions a statistician is asked is, “How many samples do I need—is a sample size of 30 appropriate?” The appropriate answer to such a question is always, “It depends!”
In today’s column, I have attached a…

Scott A. Hindle
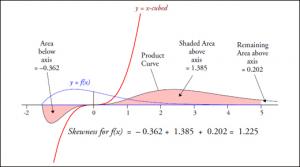
I recently got hold of the set of data shown in figure 1. What can be done to analyze and make sense of these 65 data values is the theme of this article. Read on to see what is exceptional about these data, not only statistically speaking.
Figure 1: Example data set.
A good start?
While…

Scott Weaver
The Atlantic hurricane season is now upon us, and the National Oceanic and Atmospheric Administration (NOAA) has just released its 2018 seasonal hurricane outlook which calls for a slightly above average season. The potential range of activity indicates that we could expect 10 to 16 named storms,…

Dr T Burns
Quality is related to processes. A process is “a series of actions or steps taken in order to achieve a particular end.” It doesn’t matter whether the process is the handling of invoices, customers in a bank, the manufacture or assembly of parts, insurance claims, the sick passing through a…

Cheryl Pammer
Confidence intervals show the range of values we can be fairly, well, confident, that our true value lies in, and they are very important to any quality practitioner. I could be 95-percent confident the volume of a can of soup will be 390–410 ml. I could be 99-percent confident that less than 2…

Rip Stauffer
A lot of people in my classes struggle with conditional probability. Don’t feel alone, though. A lot of people get this (and simple probability, for that matter) wrong. If you read Innumeracy by John Allen Paulos (Hill and Wang, 1989), or The Power of Logical Thinking by Marilyn vos Savant (St.…
Donald J. Wheeler
Some properties of a probability model are hard to describe in practical terms. The explanation for this rests upon the fact that most probability models will have both visible and invisible portions. Understanding how to work with these two portions can help you to avoid becoming a victim of those…

Mike Richman
There are many subjects that we cover regularly here at Quality Digest. Chief among these are standards (ISO 9001 or IATF 16949, for example) methodologies (such as lean, Baldrige, or Six Sigma), and test and measurement systems (like laser trackers or micrometers). One topic, however, is…

Donald J. Wheeler
In The Music Man, the con man Prof. Harold Hill sells band instruments and uniforms and then tells the kids that they can play music if they will “just think about the notes and then play them.” In many ways this “think system” is similar to what you are asked to do with the define, measure,…

Evan McLaughlin
As the vice president of quality for a $1.5 billion-dollar industrial corporation, Hermann Miskelly is responsible for leading its continuous improvement effort. Now in his 10th year of a lean Six Sigma deployment, he has overseen the execution of more than 4,000 major improvement projects and…

Davis Balestracci
Customer satisfaction surveys are all the rage these days. Healthcare has a couple of “800 pound gorilla” surveyors whose services (and nontrivial expense) have been pretty much forced upon it. In many cases, targets are set that are used to drive reimbursement.
A client once shared a 186-page…

Douglas C. Fair
Here’s a quick rundown of what we covered in part one of our list of top 10 mistakes to avoid when using statistical process control (SPC): training everyone, charting everything, segregating control charts from manufacturing, “pinching” the SPC coordinator, and using SPC because it’s a “good thing…

Douglas C. Fair
As you think about your organization’s manufacturing quality efforts—what you’ve overcome and what you hope to accomplish in the future—there is something you need to know.
You: What? Who? Me?
Me: Yes, you. No matter how long you’ve been playing this game (and I know many of you have been playing…

Minitab LLC
Anticipating challenges is always a daunting task for continuous improvement professionals. Unforeseen inefficiencies in process or defects in product development can throw timelines and associated costs into disarray. How to commit to realistic forecasts and timelines when resources are limited,…

Donald J. Wheeler
Last month we looked at what the empirical rule tells us about the data in a histogram. This month we will consider if there are any commonalities between different probability models that will allow us to make categorical statements without having to know the exact form of the probability model.…

Davis Balestracci
Because of a growing movement in the health insurance industry toward not reimbursing hospitals for any expenses caused by a system-acquired infection, one health system made efforts to improve its infection rate starting in the last quarter of 2016. In June 2017, a year-over-year graph was…

Larry Silverberg
Some 20 years ago, my colleague Chau Tran and I developed a way to simulate the trajectories of millions of basketballs on the computer.
We went to the coaches and assistant coaches at North Carolina State University, where we are based, and told them we had this uncommon ability to study…

Donald J. Wheeler
How can we use descriptive statistics to characterize our data? When I was teaching at the University of Tennessee I found a curious statement in a textbook that offered a practical answer to this question. This statement was labeled as “the Empirical Rule,” and it is the subject of what follows.…

Davis Balestracci
The Individuals chart is the “Swiss Army knife” of control charts. It usually approximates the supposedly “correct” chart under most conditions, and its use is much easier to understand and explain. It can also save you a major side trip into the swamp of unnecessary calculation minutiae,…

NIST
On February 14, 1929, gunmen working for Al Capone disguised themselves as police officers, entered the warehouse of a competing gang, and shot seven of their rivals dead. The St. Valentine’s Day Massacre is famous not only in the annals of gangland history, but also in the history of forensic…

Donald J. Wheeler, James Beagle III
Whenever we make a measurement, we have to decide how many digits to record. Traditional answers for this question are often little more than guesswork glorified by time. And with digital readouts, are all the displayed digits real? This column provides a sound and practical answer to these…

Andrew Hwang
National discussions of crucial importance to ordinary citizens—such as funding for scientific and medical research, bailouts of financial institutions, and revised tax laws—inevitably involve dollar figures in the millions, billions, and trillions. Unfortunately, math anxiety is widespread even…

Donald J. Wheeler, Geraint W. Jones
The precision to tolerance ratio is commonly used to characterize the usefulness of a measurement system. While this ratio is appealingly simple, it overstates the damage due to measurement error. In this paper we show how to compute honest precision to tolerance ratios that correctly describe…