All Features

Andrew Hwang
National discussions of crucial importance to ordinary citizens—such as funding for scientific and medical research, bailouts of financial institutions, and revised tax laws—inevitably involve dollar figures in the millions, billions, and trillions. Unfortunately, math anxiety is widespread even…
Donald J. Wheeler, Geraint W. Jones
The precision to tolerance ratio is commonly used to characterize the usefulness of a measurement system. While this ratio is appealingly simple, it overstates the damage due to measurement error. In this paper we show how to compute honest precision to tolerance ratios that correctly describe…

Donald J. Wheeler
Capability ratios are widely used and sometimes misunderstood. The computer will gladly offer up values of each of the commonly used capability and performance indexes. Yet there is little appreciation of the inherent uncertainty contained in each of these numbers. Here we shall look at how to…

Mike Richman
Sustainable performance improvement is simply impossible without a firm handle on the precepts and tools of statistical process control (SPC). It is for this reason that we cover industrial statistics so frequently here at Quality Digest. After all, as the great Scottish physicist and engineer…

Bonnie Stone
Lean, also known as “lean manufacturing” or “lean production,” focuses on maximizing customer value by removing waste and eliminating defects. Lean tools are about understanding the process, looking for waste, preventing mistakes, and documenting what you did.
Let’s look at five lean tools used…

Eston Martz
Control charts take data about your process and plot it so you can distinguish between common-cause and special-cause variation. Knowing the difference is important because it permits you to address potential problems without over-controlling your process.
Control charts are fantastic for…

Scott A. Hindle, Donald J. Wheeler
In theory, a production process is always predictable. In practice, however, predictable operation is an achievement that has to be sustained, which is easier said than done. Predictable operation means that the process is doing the best that it can currently do—that it is operating with maximum…

Barbara A. Cleary
Taking time off for vacation seems to be a diminishing phenomenon among U.S. workers. Each year, Americans fail to use 662 million vacation days, and with those days $236 billion in economic opportunity is lost, according to the U.S. Travel Association.
Aside from the economic impact, there are…

Davis Balestracci
In my last column, I reflected back on my career to date and issued a challenge. Based on the relatively lukewarm response, let’s see whether I can engage a few more of you to join me on my quixotic journey.
“Trying to manage your career or your organization in a world changing as rapidly as ours…
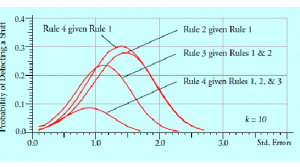
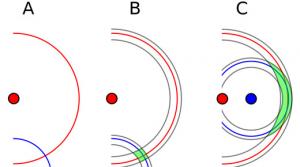
Donald J. Wheeler, Rip Stauffer
How do extra detection rules work to increase the sensitivity of a process behavior chart? What types of signals do they detect? Which detection rules should be used, and when should they be used in practice? For the answers read on.
In 1931, Walter A. Shewhart gave us the primary detection rule…

John Flaig
Story update 9/26/2017: The words "distribution of" were inadvertently left out of the last sentence of the second paragraph.
Some practitioners think that if data from a process have a “bell-shaped” histogram, then the system is experiencing only common cause variation (i.e., random variation).…

Davis Balestracci
I have reached one of those life landmarks (receiving my Medicare card) and have been reflecting back... a lot. I will remain every bit as passionate about improvement and don’t think I will ever formally retire, but I also doubt I will have W. Edwards Deming’s tenacity to keep at it until I (…
Eston Martz
The Six Sigma quality improvement methodology has lasted for decades because it gets results. Companies in every country around the world, and in every industry, have used this logical, step-by-step method to improve the quality of their processes, products, and services. And they’ve saved…

Donald J. Wheeler, James Beagle III
Sometimes we use a chart for individual values and a moving range (an XmR chart) to assess the homogeneity of a finite data set. Since this is an "off-label" use for the XmR chart, we first consider the drawbacks associated with using a sequential technique as a one-time test, and then present an…

Eston Martz
Six Sigma is a quality improvement method that businesses have used for decades—because it gets results. A Six Sigma project follows a clearly defined series of steps, and companies in every industry in every country around the world have used this method to resolve problems. Along the way, they’…

Harish Jose
It’s been a while since I’ve written about statistics. So in this column, I will be looking at the rules of three and five. These are heuristics, or rules of thumb, that can help us out. They are associated with sample sizes.
Rule of three
Let’s assume that you are looking at a binomial event (…

Ville Satopaa
At a 1906 livestock show in Plymouth, England, nearly 800 people participated in a contest to guess the weight of a slaughtered ox. The average of these estimates was 1,197 pounds. This is remarkable because the true weight of the ox turned out to be 1,198 pounds. The average was only one pound…

Barbara A. Cleary
If you get off the highway and take an alternate route when traffic slows to one lane, you are making a prediction. Likewise, if you decide to invite someone to dinner, that too is a prediction. The scientific method? Predictive in nature. Every time you make a decision, you are making a…

Davis Balestracci
Many of you work in organizations that keep track of customer complaints. Have you ever thought of how they are recorded and tallied? What could possibly be wrong with this process: The customer brings a concern to your attention. Record it.
Let’s say a certain pediatrics unit reported the number…

Dirk Dusharme
Our August 11, 2017, episode of QDL looked at the role of technology in after-market service, stairs that help you up, Fidget Cubes, and more.
“Climbing Stairs Just Got Easier With Energy-Recycling Steps”
These stairs actually help you go up.
“The Curious Case of the Fidget Cube”
How a product…

Phil Klotzbach, Michael M. Bell
June 1 marked the official start of the Atlantic hurricane season, which runs through the end of November. It’s a busy time for us at the Tropical Meteorology Project in Colorado State University’s (CSU) Department of Atmospheric Science, where we are issuing our 34th annual Atlantic basin…

Patrick Runkel
It’s usually not a good idea to rely solely on a single statistic to draw conclusions about your process. Do that, and you could fall into the clutches of the “duck-rabbit” illusion shown below.
If you fix your eyes solely on the duck, you’ll miss the rabbit—and vice-versa.
If you’re using…

John Niggl
Ever wondered why quality control (QC) professionals check a sample instead of 100 percent of a shipment during inspection? Or maybe you’ve wondered why they use acceptance sampling, rather than simply inspecting an arbitrary quantity of goods, such as 10 or 20 percent?
Most importers value the…

Donald J. Wheeler
Last month I mentioned that we can put autocorrelated data on a process behavior chart. But what is autocorrelated data and what does it tell us about our processes? This article will use examples to answer both of these questions.
Autocorrelation (aka serial correlation) describes how the values…

Davis Balestracci
Recently I demonstrated a common incorrect technique for comparing percentage rate performances—based of course in the usual normal distribution nonsense. Let’s revisit those data with a superior alternative.
To quickly review the scenario: In an effort to reduce unnecessary expensive…