Capability ratios are widely used and sometimes misunderstood. The computer will gladly offer up values of each of the commonly used capability and performance indexes. Yet there is little appreciation of the inherent uncertainty contained in each of these numbers. Here we shall look at how to quantify these uncertainties and how to interpret the ratios.
All capability ratios are statistics. This means that, like all other statistics, capability ratios will vary from computation to computation even when the underlying process does not change. The following examples will illustrate the intrinsic and extrinsic components of this variation.
A predictable process
Figure 1 shows 100 subgroup averages and ranges for subgroups of size 5 based on 500 values obtained from a bead board (or quincunx) while no changes were made in the configuration of the bead board. When operated in this manner the bead board serves as a prototype for a predictable process. The grand average is 10.084 and the average range is 4.11.

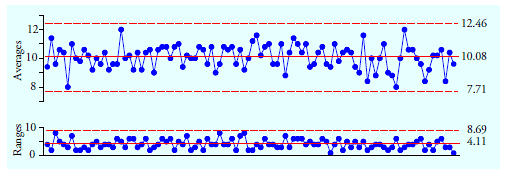
Figure 1: Average and range chart for figure 10 data
As shown in figure 2, assume the watershed specifications for the process characterized by figure 1 are 2.5 to 17.5. The natural process limits are 4.78 to 15.39. So, this process is centered, the distance to the nearer specification is DNS = [17.5-10.084] = 7.42 units, and the capability indexes are:
The global standard deviation statistic for the 500 values in figure 2 is s = 1.814. Using this value we find performance indexes of:

Figure 2: Histogram for 500 data of figure 1
Thus, the histogram and the indexes tell the same story. We have a process that is capable and well-centered within the specifications. Because this process is capable and on-target the four index numbers computed above are all estimates of the same underlying property—the capability of this production process. Yet the indexes are not all the same.
Interval estimates for capability and performance indexes
Interval estimates can help us to understand the uncertainty for any statistic. We begin with the performance ratio, Pp. When the process is operated predictably it makes sense to use the computed statistics to extrapolate from the data to the underlying process. The uncertainty of this extrapolation can be characterized by a 90-percent interval estimate (i.e., a 90% confidence interval). For the Pp statistic this 90-percent interval estimate for the process capability uses the fifth and ninety-fifth percentiles of a chi-square distribution:
where d.f. is the degrees of freedom for the global standard deviation statistic used in the denominator of Pp. Selected values of LB1 and UB1 are tabled in figure 3.
When all 500 data were used we found a performance ratio of Pp = 1.38. The degrees of freedom for the global standard deviation statistic used in computing Pp is equal to one less than the number of data used, which in this case is 499 degrees of freedom. Using the critical values for 500 degrees of freedom we find a 90-percent interval estimate for the process capability of 1.31 to 1.45.

Figure 3: Factors for 90% interval estimates for Cp and Pp
When a process is operated predictably both the performance ratio and the capability ratio are two estimates of the same quantity. For this reason, the critical values in figure 3 can also be used to obtain an approximate 90% interval estimate based on the capability ratio Cp:
However, since the capability ratio uses a within-subgroup measure of dispersion, it will have a different number of degrees of freedom than does the performance ratio. Here the capability ratio was based on the average range, and the average range for k = 100 subgroups of size five has an effective degrees of freedom of:
where d2 and d3 are the bias correction factors for ranges of subgroups of size five. Thus, using the critical values from figure 3 for 350 degrees of freedom with the calculated Cp value of 1.42 we find an approximate 90-percent interval estimate for the process capability of 1.33 to 1.51.
Thus, even when we use 500 data to compute a capability ratio or a performance ratio, the intrinsic uncertainty in our statistics will still be ± 5 or 6 percent.
Interval estimates for centered indexes
The centered performance ratio, Ppk and the centered capability ratio, Cpk have the grand average in the numerator. This introduces additional uncertainty into these ratios and requires a different computation for their interval estimates. The centered performance ratio, Ppk is the minimum of two statistics where each statistic can be characterized by a noncentral Student’s t-distribution. Chou, Owen, and Borrego [JQT v.22, July 1990] show that the exact interval estimate depends strongly upon the degrees of freedom and depends weakly upon the value of the centered performance ratio. By ignoring the weak dependency we can create approximate critical values that are suitable for use in practice. As before, when the process is operated predictably, an approximate 90-percent interval estimate for the centered process capability will be:

|
The values for LB2 and UB2 will depend upon the degrees of freedom for the global standard deviation statistic used in the denominator of Ppk. Selected values of LB2 and UB2 are tabled in figure 4.
When a process is operated predictably both the centered performance ratio and the centered capability ratio are two estimates of the same quantity. For this reason, the critical values in figure 4 can also be used to obtain an approximate 90-percent interval estimate of the centered process capability based on the centered capability ratio Cpk:
Here the values for LB2 and UB2 will depend upon the degrees of freedom for the average range, or other within-subgroup measure of dispersion, used in the denominator of Cpk.
Figure 4: Factors for approximate 90% interval estimates for Cpk and Ppk
For figure 1 we found a centered performance ratio of Ppk = 1.36. With 499 degrees of freedom we use the critical values for 500 degrees of freedom of 0.939 and 1.063 to compute an approximate 90% interval estimate of the centered process capability of 1.28 to 1.45:
We also found Cpk = 1.40. With 363 degrees of freedom we might use the critical values for 350 degrees of freedom of 0.927 and 1.075 to obtain an approximate 90-percent interval estimate for the centered process capability of 1.30 to 1.51:
So, even when using 500 data, our two estimates of the effective space available for this process will have uncertainties of ± 6 to 7 percent. However, it is not common to use 500 values when computing these indexes. More often we use 30 to 50 data in these computations. So let us divide the 500 data of figure 1 into 10 blocks, each consisting of 10 subgroups of size five, and compute the capability and performance indexes for each of these blocks of 50 values. The resulting values are shown in figure 5.
Figure 5: 10 sets of capability and performance indexes for the figure 1 data
This process is being operated predictably and it is well-centered within the specifications. Under these conditions the capability and performance indexes in figure 5 are 40 estimates of the same quantity. Yet, like all statistics, these 40 estimates differ. While this process is likely to meet the customer requirement of having a capability that exceeds 1.33, 13 of the 40 indexes in figure 5 fall below 1.33. If we used one of these 13 indexes to characterize this process it is likely that inappropriate and unnecessary process changes would be made. When we do not allow for the inherent variation in our capability indexes we can end up creating trouble.
Each of the capability and centered capability ratios of figure 5 has 36.5 degrees of freedom. Interpolating in figure 3 we find LB1 = 0.805 and UB1 = 1.189. Interpolating in figure 4 we find LB2 = 0.751 and UB2 = 1.274. Using these critical values with each of the capability and centered capability ratios in figure 5 we get the approximate 90-percent interval estimates shown in figure 6.
Each of the performance and centered performance ratios of figure 5 has 49 degrees of freedom. Interpolating in figure 3 we find LB1 = 0.832 and UB1 = 1.164. Interpolating in figure 4 we find LB2 = 0.790 and UB2 = 1.225 Using these critical values with the performance and centered performance ratios in figure 5 we get the 90-percent interval estimates shown in figure 6.
Figure 6: 90% interval estimates for figure 5 capability and performance indexes

Figure 7: 90% interval estimates for figure 5 capability and performance indexes
Figure 7 shows the interval estimates for the capability and centered capability ratios in red and those for the performance and centered performance ratios in blue. Here these intervals overlap more than they differ, and they all tell the same story. While 13 of the 40 indexes fell below 1.33, figures 6 and 7 reveal that all of the indexes are consistent with having a process with a capability of 1.33 or more. (If we compare the intervals above with the indexes computed using all 500 data, 39 of these 40 90% interval estimates contain the corresponding estimate of 1.42, 1.40, 1.38, or 1.36 found earlier.) Thus, these interval estimates show the inherent uncertainty attached to each statistic and also serve to characterize the underlying capability of this predictable process.
An unpredictable process
Figure 8 shows 100 averages and ranges for subgroups of size five based on 500 values obtained from a bead board while the configuration of the bead board was changed periodically. These data serve as a prototype for an unpredictable process. The grand average is 12.86, the average range is 3.95, and the global standard deviation statistic is s = 3.326. The specifications are still 2.5 to 17.5, while the natural process limits are 7.76 to 17.95.

Figure 8: Average and range chart for an unpredictable process
Not only is this process being operated unpredictably, but it also is being operated off-target. Thirty-seven of the 500 values are out of specification, which is 7.4-percent nonconforming. The histogram for these 500 data is shown in figure 9.

Figure 9: Histogram of the 500 data used for figure 8
If we divide the 500 data used for figure 8 into 10 blocks, each consisting of 10 subgroups of size five, we get the capability and performance indexes shown in figure 10. Unlike the earlier values in figure 5, the values in each column of figure 10 are quantitatively different from those in the other columns.
Figure 10: 10 sets of capability and performance indexes for the figure 9 data
Since the degrees of freedom for the ratios in figure 10 are the same as for those in figure 5, we can use the critical values found earlier to compute 90-percent interval estimates for the ratios of figure 10. When we do this we end up with the intervals shown in figure 11. The red bars show the intervals for the capability and centered capability ratios, while the blue bars show the intervals for the performance and centered performance ratios.

Figure 11: 90% intervals for figure 10 capability and performance indexes
The intervals in figure 11 do not overlap with each other in the same way or to the same extent that the intervals of figure 7 did. Here there are also substantial differences in the intervals as we go from one block of 50 data to another.
For each block of data the first interval is for the capability ratio. These are always the highest values for that block because this statistic characterizes what the process has the ability to do if and when it is operated predictably and on-target. It characterizes the hypothetical capability.
For each block the second interval is for the centered capability ratio. These intervals are lower that the preceding interval because this statistic characterizes what the process is likely to do if it is operated predictably at the historical average. It characterizes another hypothetical capability.
The third interval for each block is for the performance ratio. These intervals characterize what the capability of the past production would have been if the process was centered within the specifications. This is yet another hypothetical measure of capability.
For each block of data the last interval is for the centered performance ratio. These are always the lowest values for each block because this statistic summarizes the past performance of the process while that block of data was collected. It describes the process as it was, where it was, with all of its warts and pimples included. While these statistics describe the past performance, and while these intervals describe the inherent uncertainty in the statistics, they cannot be relied upon to characterize the future when the underlying process is unpredictable.
So, when the process is unpredictable, three of the indexes are hypothetical and the other one describes the past. However, neither the statistics nor their intervals can deal with the extrinsic uncertainty introduced by the unpredictable nature of the underlying process. If we use all 500 data from figure 8 we find a performance ratio of 0.75. Yet only six of the 10 intervals for the performance ratios in figure 11 include the value of 0.75. Is that what you would expect from a set of 90-percent interval estimates?
If we use all 500 data from figure 8 we find a centered performance ratio of 0.47, yet only three of the 10 intervals for the centered performance ratios in figure 11 include the value of 0.47. Once again, is this what you would expect from a set of 90-percent interval estimates?
Neither the indexes nor their “confidence intervals” can handle the extrinsic variation of an unpredictable process.
So when do these capability and performance indexes change from being hypothetical or descriptive measures and start being estimates of actual process capability? It is the predictability of the underlying process that turns the statistics into estimates of actual capability. As long as the process is operated unpredictably it does not possess a well-defined capability.
As Walter A. Shewhart put it, “Measurements of phenomena in both social and natural science for the most part obey neither deterministic nor statistical laws until assignable causes of variability have been found and removed.” When there is no probability model there are no parameters to estimate. We may calculate as many statistics as we wish, but none of these will estimate anything real.
It is the predictability of figure 1 that turns the intervals in figures 6 and 7 into estimates of the process capability. The unpredictability of figure 8 means that there is no well-defined process capability for the intervals of figure 11 to estimate. So, while the statistics in figure 10 describe hypothetical possibilities or summarize the past, and while the intervals of figure 11 describe the intrinsic uncertainty in these statistics, the question of whether these indexes are hypothetical or actual, and whether they can be used to predict the future will depend upon whether or not the process is being operated predictably.
Summary
Process behavior charts and histograms with specification limits allow you to compare the voice of the process with the voice of the customer. Numerical summaries complement these graphic comparisons but they cannot replace them. The main problem with numerical summaries is not their computation but rather their interpretation, since their meaning changes with the status of the process.
When the process is operated predictably the capability ratio Cp and the performance ratio Pp both characterize the same thing—the space available for the process. They both express the specified tolerance as a percentage of the space consumed by the natural process variation.
Interval estimates for these ratios make sense.
When the process is operated predictably the centered capability ratio Cpk and the centered performance ratio Ppk both characterize the same thing—the effective space available for the process. They both compare twice the distance to the nearer specification (DNS) with the generic space required by natural process variation. If the process is well-centered within the specifications these ratios will converge to the two ratios above. Interval estimates for these ratios make sense.
When the process is operated unpredictably the capability ratio Cp and the performance ratio Pp describe different characteristics of the data.
When the process is operated unpredictably the capability ratio Cp provides a data-based estimate of the hypothetical capability that the process is likely to achieve if and when the assignable causes of exceptional variation are found and made part of the set of control factors for the process. Interval estimates make hypothetical sense as a way to characterize the intrinsic uncertainty of this hypothetical value.
When the process is operated unpredictably the performance ratio Pp will describe the past performance of the process. It expresses the specified tolerance as a percentage of the generic space used by the past process outcomes. With an unpredictable process Pp will always be smaller than Cp because the global dispersion will be greater than the within-subgroup variation. Intervals are not estimates of any well defined property of the process, but do quantify the intrinsic uncertainty in the descriptive statistic.
When the process is operated unpredictably the centered capability ratio Cpk and the centered performance ratio Ppk describe different characteristics of the data.
When the process is operated unpredictably the centered capability ratio Cpk describes the hypothetical capability that the process is likely to achieve if the process is operated predictably at the historical average. Since we gain leverage for changing the process aim as we identify assignable causes and make them part of the set of control factors, this hypothetical value of little interest in most cases. Since the centered capability ratio is essentially a lower bound for the hypothetical capability, intervals are rarely of interest here.
When the process is operated unpredictably the centered performance ratio Ppk describes the past performance relative to the specifications. Intervals can describe the intrinsic uncertainty in the descriptive statistic, but they do not estimate any property of the process.
Because of the shifting meanings for these commonly computed indexes it is impossible to ever have a meaningful discussion using the capability or performance indexes alone. You will always need to know whether or not the underlying process is being operated predictably before you know how to interpret and use a capability or performance index.
Quality Digest does not charge readers for its content. We believe that industry news is important for you to do your job, and Quality Digest supports businesses of all types.
However, someone has to pay for this content. And that’s where advertising comes in. Most people consider ads a nuisance, but they do serve a useful function besides allowing media companies to stay afloat. They keep you aware of new products and services relevant to your industry. All ads in Quality Digest apply directly to products and services that most of our readers need. You won’t see automobile or health supplement ads.
Our PROMISE: Quality Digest only displays static ads that never overlay or cover up content. They never get in your way. They are there for you to read, or not.
So please consider turning off your ad blocker for our site.
Thanks,
Quality Digest