{domain:"www.qualitydigest.com",server:"169.47.211.87"} Skip to main content

User account menu
Main navigation
  • Topics
    • Customer Care
    • FDA Compliance
    • Healthcare
    • Innovation
    • Lean
    • Management
    • Metrology
    • Operations
    • Risk Management
    • Six Sigma
    • Standards
    • Statistics
    • Supply Chain
    • Sustainability
    • Training
  • Videos/Webinars
    • All videos
    • Product Demos
    • Webinars
  • Advertise
    • Advertise
    • Submit B2B Press Release
    • Write for us
  • Metrology Hub
  • Training
  • Subscribe
  • Log in
Mobile Menu
  • Home
  • Topics
    • 3D Metrology-CMSC
    • Customer Care
    • FDA Compliance
    • Healthcare
    • Innovation
    • Lean
    • Management
    • Metrology
    • Operations
    • Risk Management
    • Six Sigma
    • Standards
    • Statistics
    • Supply Chain
    • Sustainability
    • Training
  • Login / Subscribe
  • More...
    • All Features
    • All News
    • All Videos
    • Contact
    • Training

Cp and Cpk: Two Process Perspectives, One Process Reality

Avoid getting too fixated on any single statistic

Cp and Cpk work together, like this image of the rabbit and duck.
Patrick Runkel
Wed, 08/09/2017 - 12:02
  • Comment
  • RSS

Social Sharing block

  • Print
Body

It’s usually not a good idea to rely solely on a single statistic to draw conclusions about your process. Do that, and you could fall into the clutches of the “duck-rabbit” illusion shown below.

ADVERTISEMENT

If you fix your eyes solely on the duck, you’ll miss the rabbit—and vice-versa.

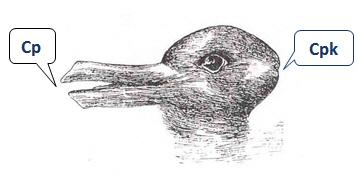
If you’re using Minitab Statistical Software for capability analysis, the capability indices Cp and Cpk are good examples of this. If you focus on only one measure, and ignore the other, you might miss seeing something critical about the performance of your process. 

Cp: A tale of two tails

Cp is a ratio of the specification spread to the process spread. The process spread is often defined as the 6-sigma spread of the process (that is, 6 times the within-subgroup standard deviation). Higher Cp values indicate a more capable process.

When the specification spread is considerably greater than the process spread, Cp is high.

 …

Want to continue?
Log in or create a FREE account.
Enter your username or email address
Enter the password that accompanies your username.
By logging in you agree to receive communication from Quality Digest. Privacy Policy.
Create a FREE account
Forgot My Password

Add new comment

Image CAPTCHA
Enter the characters shown in the image.
Please login to comment.
      

© 2025 Quality Digest. Copyright on content held by Quality Digest or by individual authors. Contact Quality Digest for reprint information.
“Quality Digest" is a trademark owned by Quality Circle Institute Inc.

footer
  • Home
  • Print QD: 1995-2008
  • Print QD: 2008-2009
  • Videos
  • Privacy Policy
  • Write for us
footer second menu
  • Subscribe to Quality Digest
  • About Us
  • Contact Us