Content by Donald J. Wheeler

Wed, 02/06/2019 - 12:03
With the click of your mouse you can turn a list of values into a bubble plot. No thought or effort is required. Simply sit back and let the software gods do the heavy lifting of transforming your list of numbers into a fancy graph. What could…
Wed, 01/09/2019 - 12:03
Story update 1/15/2019: Thanks to the sharp eye of Dr. Stan Alekman, who spotted an inconsistent value in figure 2, I discovered an error in the program used to construct the table of critical values for the prediction ratio. I have now corrected…
Mon, 12/03/2018 - 12:03
Process behavior charts are the interface between your data and your brain. But you have to begin by making a choice about which type of chart to use. You can either plot the individual values themselves, or you can organize your data into rational…
Thu, 11/08/2018 - 12:03
In Part One and Part Two of this series we discovered some caveats of data snooping. In Part Three we discovered how listening to the voice of the process differs from the model-based approach and how it also provides a way to understand when our…
Mon, 10/01/2018 - 12:03
Parts One and Two of this series illustrated four problems with using a model-building approach when data snooping. This column will present an alternative approach for data snooping that is of proven utility. This approach is completely empirical…
Mon, 09/10/2018 - 12:03
In “Data Snooping Part 1” (Quality Digest, Aug. 6, 2018) we discovered the basis for the first caveat of data snooping. Here we discover three additional caveats of data snooping.
Last month we discovered:
Here we will use the data set from Part…
Mon, 08/06/2018 - 12:03
Data mining is the foundation for the current fad of “big data.” Today’s software makes it possible to look for all kinds of relationships among the variables contained in a database. But owning a pick and shovel will not do you much good if you do…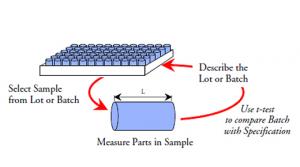
Mon, 07/16/2018 - 12:03
The ultimate purpose for collecting data is to take action. In some cases the action taken will depend upon a description of what is at hand. In others the action taken will depend upon a prediction of what will be. The use of data in support of…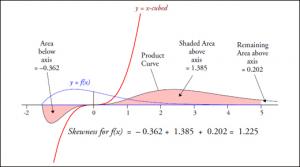
Mon, 06/04/2018 - 12:03
Some properties of a probability model are hard to describe in practical terms. The explanation for this rests upon the fact that most probability models will have both visible and invisible portions. Understanding how to work with these two…
Mon, 05/07/2018 - 12:03
In The Music Man, the con man Prof. Harold Hill sells band instruments and uniforms and then tells the kids that they can play music if they will “just think about the notes and then play them.” In many ways this “think system” is similar to what…