Content by Donald J. Wheeler
Mon, 04/02/2018 - 12:03
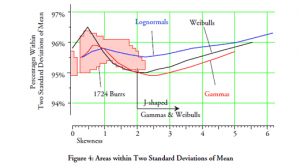
Last month we looked at what the empirical rule tells us about the data in a histogram. This month we will consider if there are any commonalities between different probability models that will allow us to make categorical statements without having…
Mon, 03/05/2018 - 12:03
How can we use descriptive statistics to characterize our data? When I was teaching at the University of Tennessee I found a curious statement in a textbook that offered a practical answer to this question. This statement was labeled as “the…
Mon, 02/05/2018 - 12:03
Whenever we make a measurement, we have to decide how many digits to record. Traditional answers for this question are often little more than guesswork glorified by time. And with digital readouts, are all the displayed digits real? This column…
Mon, 01/08/2018 - 12:03
The precision to tolerance ratio is commonly used to characterize the usefulness of a measurement system. While this ratio is appealingly simple, it overstates the damage due to measurement error. In this paper we show how to compute honest…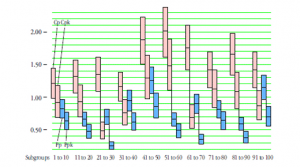
Mon, 12/04/2017 - 12:03
Capability ratios are widely used and sometimes misunderstood. The computer will gladly offer up values of each of the commonly used capability and performance indexes. Yet there is little appreciation of the inherent uncertainty contained in each…
Mon, 11/06/2017 - 12:03
In theory, a production process is always predictable. In practice, however, predictable operation is an achievement that has to be sustained, which is easier said than done. Predictable operation means that the process is doing the best that it…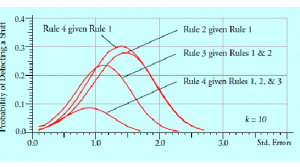
Mon, 10/09/2017 - 12:03
How do extra detection rules work to increase the sensitivity of a process behavior chart? What types of signals do they detect? Which detection rules should be used, and when should they be used in practice? For the answers read on.
In 1931, …
Tue, 09/05/2017 - 12:03
Sometimes we use a chart for individual values and a moving range (an XmR chart) to assess the homogeneity of a finite data set. Since this is an "off-label" use for the XmR chart, we first consider the drawbacks associated with using a sequential…
Mon, 08/07/2017 - 12:03
Last month I mentioned that we can put autocorrelated data on a process behavior chart. But what is autocorrelated data and what does it tell us about our processes? This article will use examples to answer both of these questions.
Autocorrelation…
Mon, 07/10/2017 - 12:03
The simplest type of process behavior chart is the chart for individual values and a moving range. It allows us to plot a point every time we get a value, making it perfect for data that occur one value at a time. A brief history of this simple…