Reverse-Engineer Your Experiments
Everybody wants to design and conduct a great experiment! To find enlightenment by the discovery of the big red X and perhaps a few smaller pink x’s along the way.
In this article I will show that the conventional method for calculating uncertainty is not always reliable.
Walter Shewhart, father of statistical process control and creator of the control chart, put a premium on the time order sequence of data.
Machine learning as a tool in your analytical toolkit can help accelerate the discovery of insights in data that can create a more efficient manufacturing process and drive innovation.
Process behavior charts are the interface between your data and your brain. But you have to begin by making a choice about which type of chart to use.
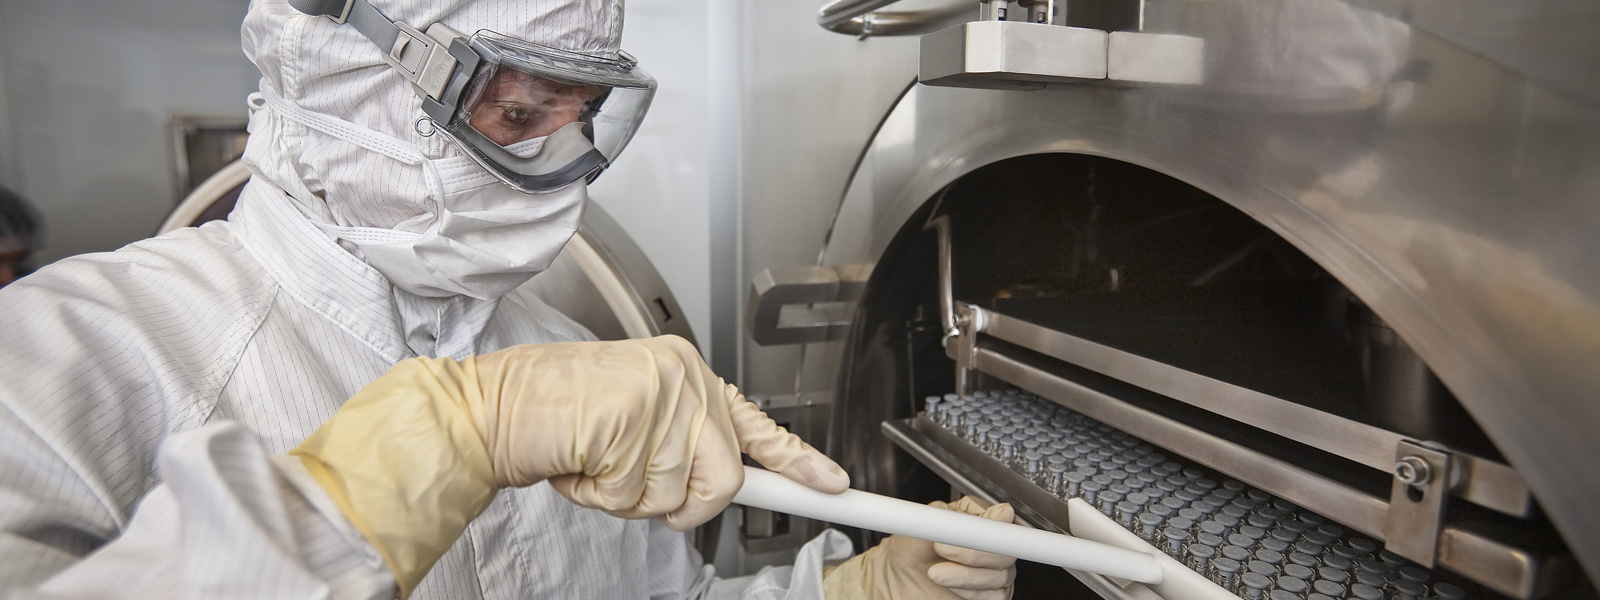
Process validation is vital to the success of companies that manufacture pharmaceutical drugs, vaccines, test kits, and a variety of other biological products for people and animals.
This is the second article in a three-part series to help readers distinguish good metrics from bad. In part one we discussed good metrics.
Perhaps the reader recognizes d2 as slang for “designated driver,” but quality professionals will recognize it as a control chart constant used to estimate short-term variation of a process.
Choosing the correct linear regression model can be difficult. Trying to model it with only a sample doesn’t make it any easier.
© 2026 Quality Digest. Copyright on content held by Quality Digest or by individual authors. Contact Quality Digest for reprint information.
“Quality Digest" is a trademark owned by Quality Circle Institute Inc.