All Features

Prasanth Sambaraju
The Weibull distribution is a continuous probability distribution often used in reliability analysis to model time-to-failure and product lifespans.
It has applications in engineering, medicine, energy, and insurance. It’s also good at describing survival statistics, such as survival times after…

Donald J. Wheeler
Many erroneously think of a process behavior chart as a technique for monitoring a process. Consequently, they consider other monitoring techniques as alternatives to a process behavior chart. One of these proposed alternatives is an exponentially weighted moving average (EWMA). While an EWMA may…

Donald J. Wheeler
In the 1980s, demand for SPC classes outstripped the supply of competent instructors. Novices were teaching neophytes, and misinformation could be found everywhere. Out of this chaos, many incorrect ideas about process behavior charts became widely circulated. These ideas continue to be spread by…

Donald J. Wheeler
The way we think about our process will shape the way we collect, analyze, and interpret our data when things go wrong. This in turn will shape the actions taken and the results obtained. In this column, we look at an example of the difference between the traditional approach and an alternate…

Jeffrey T. Slovin
Manufacturers can’t control tariffs, supply chain volatility, labor shortages, or geopolitical instability. But they can manage operational efficiency.
Operational excellence is one of the few factors that organizations can fully control. In challenging economic times, quality is an increasingly…

Donald J. Wheeler
Many practitioners have been taught to describe a process using sigma levels. Yet these levels are commonly misinterpreted. This article will help you to understand the problem and learn more appropriate ways of describing your process.
In the days before handheld calculators and personal…

Donald J. Wheeler
Most data in business and industry belong to the category known as observational data. These data are the voice of your processes because they are the result of ordinary operations rather than an experiment.
Because the purpose of analysis is insight, the question is how to analyze observational…

Donald J. Wheeler
Performance indexes use the global standard deviation statistic to describe the past. Capability indexes use a within-subgroup measure of dispersion to characterize the process potential. However, some within-subgroup measures are better than others. This article will explain why you should not use…

Donald J. Wheeler
One of the principles for understanding data is that while some data contain signals, all data contain noise. Therefore, before you can detect the signals you’ll have to filter out the noise. This act of filtration is the essence of all data analysis techniques. It’s the foundation for our use of…

Donald J. Wheeler
When administrative and managerial data are placed on an XmR chart, the first reaction will frequently be that the limits are far too wide: “We have to react before we get to that limit.”
So what are we to do when this happens? Are the limits really too wide? There are three cases to consider:•…

Donald J. Wheeler
Everybody wants to have good measurements. To this end, many recommend a regular schedule of recalibration. While this sounds reasonable, it can actually degrade the quality of the measurements.
The key to getting the most out of a measurement process is to know when to recalibrate and when to…

Creaform
C hallenges abound for today’s manufacturers. Labor shortages and rising labor costs require innovative solutions to maintain productivity with fewer staff. Inflation continues to exert pressure on raw material costs, squeezing margins. Manufacturers are also racing against tight production…

Donald J. Wheeler
The engineer came into the statistician’s office and asked, “How can I compare a couple of averages? I have 50 values from each machine and want to compare the machines.”
The statistician answered, “That’s easy. We can use a two-sample t-test.”
“How would that work?” asked the engineer.
“We…

Knowledge at Wharton
Many countries face the reality of demographic aging: Fertility is plummeting and people are living longer. This raises critical challenges for the labor market, healthcare, and long-term care markets, as well as retirement systems and financial planning. A Wharton symposium on the implications of…

Donald J. Wheeler
In statistics class we learn that we can reduce the uncertainty in our estimates by using more and more data. This effect has been called the “law of large numbers” and is one of the primary ideas behind the various big data techniques that are becoming popular today. Here we’ll look at how the law…

Zach Winn
Modern fighter jets contain hundreds or even thousands of sensors. Some of those sensors collect data every second, others every nanosecond. For the engineering teams building and testing those jets, all those data points are hugely valuable—if they can make sense of them.
Nominal is an advanced…

Gleb Tsipursky
As companies and government agencies push forward with return-to-office (RTO) mandates, they risk exacerbating a workplace problem that many have failed to address adequately: gender discrimination.
New research from the University of Toronto’s Rotman School of Management highlights how in-person…

Conformance1
Amid uncertainty in manufacturing, AI adoption, labor market fluctuations, and salary disparities across industries and geographic regions, quality professional compensation can be difficult to calculate. Without current job-level salary benchmarks, quality professionals, from technicians to…
Quality Digest
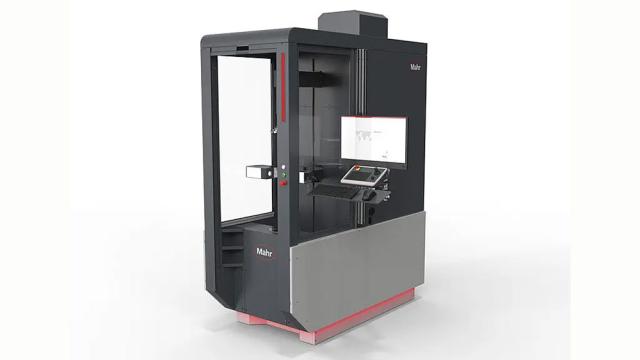
(Mahr: Providence, RI) -- Mahr Inc., a leading provider of dimensional metrology solutions, announced its Mar4D PLQ 4200 line of cylinder coordinate measuring machines. This innovative solution offers workpiece flexibility and multisensory technology, making it ideal for a wide range of…

Donald J. Wheeler
For many hundreds of years, “If it ain’t broke, don’t fix it” has summarized the predominant approach to process operation. From the physician’s admonition to do no harm, to the slightly more positive aphorism that the squeaky wheel gets the grease, there is a common theme of differentiating…

Reinfried Kößlbacher
Just like in the Star Trek holodeck, digital twins are virtual replicas of the physical world. They enable industries to predict and optimize processes using live data. In manufacturing, digital twins create a real-time digital profile of production lines, assets, and processes. Manufacturers can…

Donald J. Wheeler
Define, measure, analyze, improve, control, goes the mantra used to carry out improvement projects in many companies. In various books, these steps get slightly different interpretations. But the overall outline is still characterized by DMAIC. This article will show a proven way to simplify and…

Quality Digest, Donald J. Wheeler
Dr. Donald J. Wheeler has been one of Quality Digest’s most highly read authors for decades. His teaching on the use of control charts in industrial settings has long been considered the gold standard. He has conducted more than 1,100 seminars in 17 countries on six continents, and his books have…

Donald J. Wheeler
Outliers are values that don’t “fit in” with the rest of the data. These extreme values are commonly considered a nuisance when we seek to summarize the data with our descriptive statistics. This article will show how to turn these nuisances into useful information.
The earliest statistical tests…

Hannah Fischer-Lauder
In an age where data are among the most valuable assets for any business, the ability to retrieve, process, and utilize information efficiently is critical for success. Yet traditional data-retrieval methods often struggle with the demands of today’s dynamic business environments. Enter retrieval-…