
Photo by Peter Robbins on Unsplash
Social Sharing block
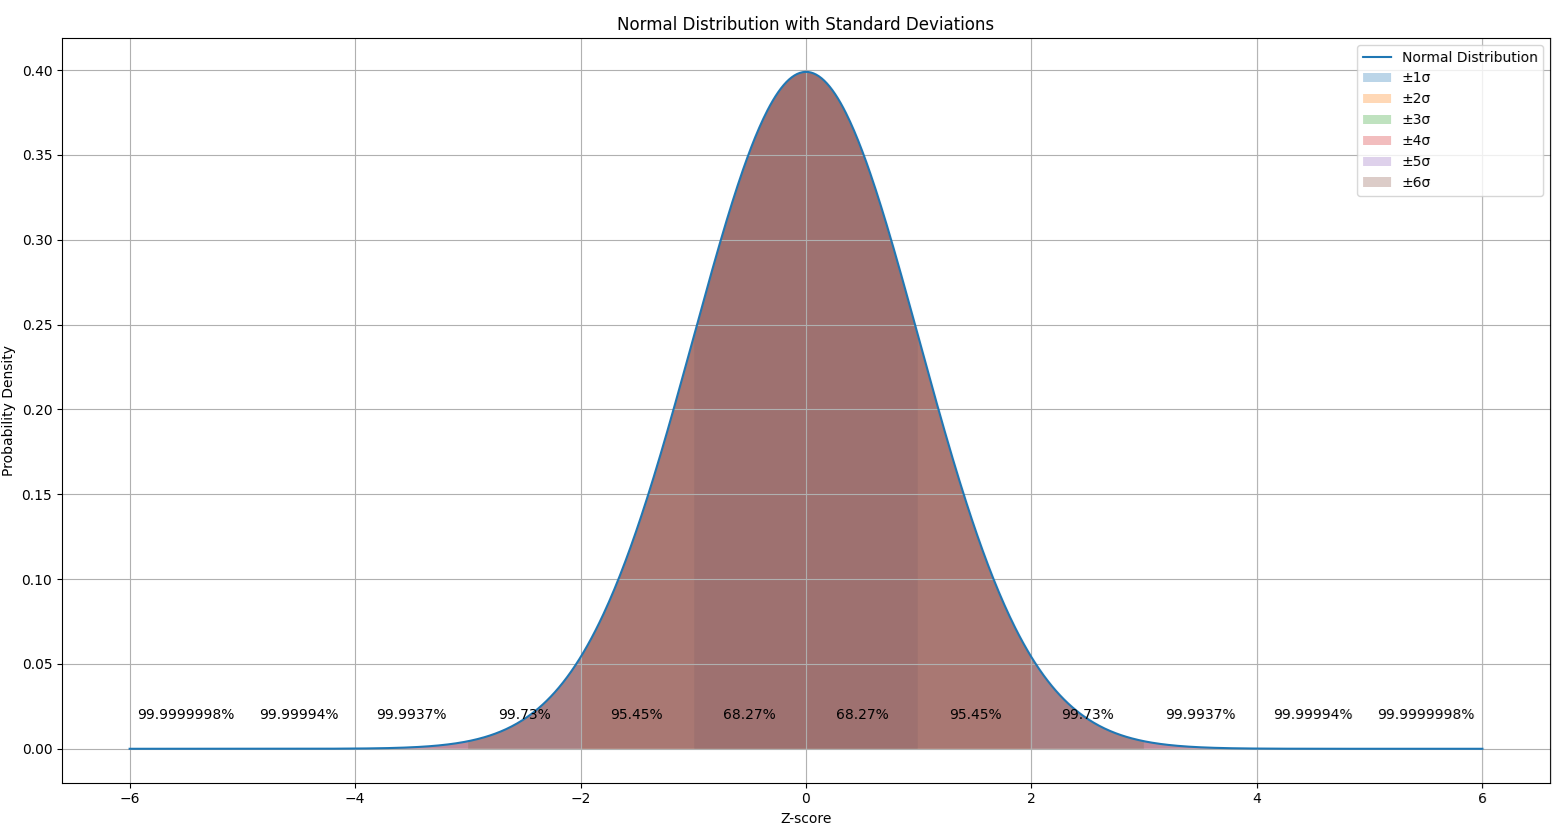
Recently, I wrote about the process capability index and tolerance interval. Here, I’m writing about the relationship between the process capability index and sigma. The sigma number here relates to how many standard deviations the process window can hold.
|
ADVERTISEMENT |
A +/– 3 sigma contains 99.73% of the normal probability density curve. This is also traditionally notated as the “process window.” The number of sigmas is also the z-score. When the process window is compared against the specification window, we can assess the process capability. When the process window is much narrower than the specification window and is fully contained within the specification window, we say that the process is highly capable. When the process window is larger than the specification window, we say that the process isn’t capable.
…
Comments
Overly narrow treatment?
Given that capability confusion is somewhat common, does your narrow treatment of the topic not risk propagating this “confusion”?
Capability indexes, as I have no doubt you know, are reliable, or well-defined, indicators if, and only if, the process data display a reasonable degree of consistency (i.e. stable or “in control” process). All these assumptions of probability models are misleading unless there is some reasonable evidence of process stability over time.
Moreover, wouldn’t it also be advantageous to make a clear separation between Cp/Cpk as “capability indexes” and Pp/Ppk as “(past) performance indexes”?
Lastly, rather than getting bogged down in calculations how about keeping things simple with a primary use of time-series plots, control charts and histograms?
Capability indices add no value
Capability indices are not a substitute for a control chart plus histogram. These statistics add no value, as my animation demonstrates:
https://www.linkedin.com/posts/dr-tony-burns-b040541_is-capability-as-much-nonsense-as-oee-cp-activity-7221256560197476354-3kOJ?
Accuracy of Inferences
You said in your previous article (linked in this one)
The accuracy of our inferences will depend on how closely the actual process probability distribution curve matches the beautiful symmetric normal curve.
This sounds at odds in several ways with Dr. Deming's recommendations in Dr. Shewhart's second book**
"An inference, if it is to have scientific value, must constitute a prediction concerning future data. If the inference is to be made purely with the help of the distribution theories of statistics, the experiments that constitute the evidence for the inference must arise from a state of statistical control; until that state is reached, there is no universe, normal or otherwise, and the statistician’s calculations by themselves are an illusion if not a delusion. The fact is that when distribution theory is not applicable for lack of control, any inference, statistical or otherwise, is little better than conjecture. The state of statistical control is therefore the goal of all experimentation,"
**Shewhart, Walter A. (Walter Andrew), 1891-1967. Statistical Method from the Viewpoint of Quality Control. Washington: The Graduate School, The Department of Agriculture, 1939.
Thanks,
Allen
Add new comment