{domain:"www.qualitydigest.com",server:"169.47.211.87"} Skip to main content

        
User account menu
Main navigation
  • Topics
    • Customer Care
    • Regulated Industries
    • Research & Tech
    • Quality Improvement Tools
    • People Management
    • Metrology
    • Manufacturing
    • Roadshow
    • QMS & Standards
    • Statistical Methods
    • Resource Management
  • Videos/Webinars
    • All videos
    • Product Demos
    • Webinars
  • Advertise
    • Advertise
    • Submit B2B Press Release
    • Write for us
  • Metrology Hub
  • Training
  • Subscribe
  • Log in
Mobile Menu
  • Home
  • Topics
    • Customer Care
    • Regulated Industries
    • Research & Tech
    • Quality Improvement Tools
    • People Management
    • Metrology
    • Manufacturing
    • Roadshow
    • QMS & Standards
    • Statistical Methods
    • Supply Chain
    • Resource Management
  • Login / Subscribe
  • More...
    • All Features
    • All News
    • All Videos
    • Contact
    • Training

What Is Measurement Risk?

How to understand it and lower it

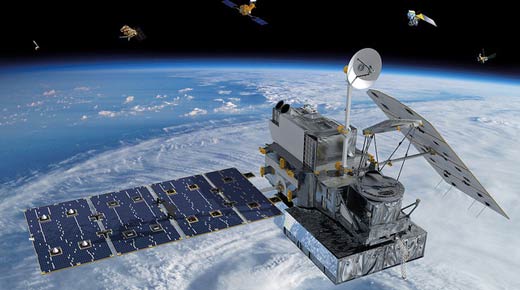
Understanding measurement risk can mean the difference between a successful mission or a failed one
Credit: NASA Goddard Space Flight Center

Henry Zumbrun
Wed, 04/05/2017 - 12:03
  • Comment
  • RSS

Social Sharing block

  • Print
Body

Imagine that a satellite is launched into space and communications are intermittent. This happens because the satellite is wobbling, which causes connection problems in the receiver. The cause of the wobbling is identified: It is the result of not using a calibration provider with a low enough uncertainty.

ADVERTISEMENT

The load cells used to measure the amount of fuel stored in the satellite must be almost perfect. However, if a calibration provider doesn’t have the right measurement capability, the load cells won’t be accurate enough to make the measurement. In this case, the result is a wobbling satellite and significant resources needed to fix the problem.

 …

Want to continue?
Log in or create a FREE account.
Enter your username or email address
Enter the password that accompanies your username.
By logging in you agree to receive communication from Quality Digest. Privacy Policy.
Create a FREE account
Forgot My Password
Top Stories
AI May Be Making Your Quality Problem Worse
The 6 Best Quality Management Software Features That Simplify Your QMS
What I Discovered About Quality Concepts by Watching My Newborn Granddaughter
Why Products Still Fail RoHS, REACH, and POPs Compliance
Your AI Model Is Drifting Right Now. Would You Know?

Comments

Submitted by Stanley Alekman on Wed, 04/05/2017 - 10:39

The graphs suggest a commercial program for the calculations.

Is there a commercial program to automate the calculations and present the graphics you depict in the article?

  • Reply

Submitted by ccwerner55 on Wed, 04/05/2017 - 14:01

In reply to The graphs suggest a commercial program for the calculations. by Stanley Alekman

Commercial software

Stanley

Take a look at Minitab. It should be useful for this type of data gathering and presentation.

  • Reply

Add new comment

Please login to comment.

© 2026 Quality Digest. Copyright on content held by Quality Digest or by individual authors. Contact Quality Digest for reprint information.
“Quality Digest" is a trademark owned by Quality Circle Institute Inc.

footer
  • Home
  • Print QD: 1995-2008
  • Print QD: 2008-2009
  • Videos
  • Privacy Policy
  • Write for us
footer second menu
  • Subscribe to Quality Digest
  • About Us
  • Contact Us