Which Chart to Use?
Process behavior charts are the interface between your data and your brain. But you have to begin by making a choice about which type of chart to use.
Twitter RSS Feed. Stories for Twitter go here.
Process behavior charts are the interface between your data and your brain. But you have to begin by making a choice about which type of chart to use.
Each year, billions in funding for research and development as well as workforce initiatives is available for small and medium-sized manufacturers (SMMs) to help them get off the ground or aid in expansion efforts.
The high school students clustered around a 4 ft-tall red robot with long arms and cartoonish eyes.
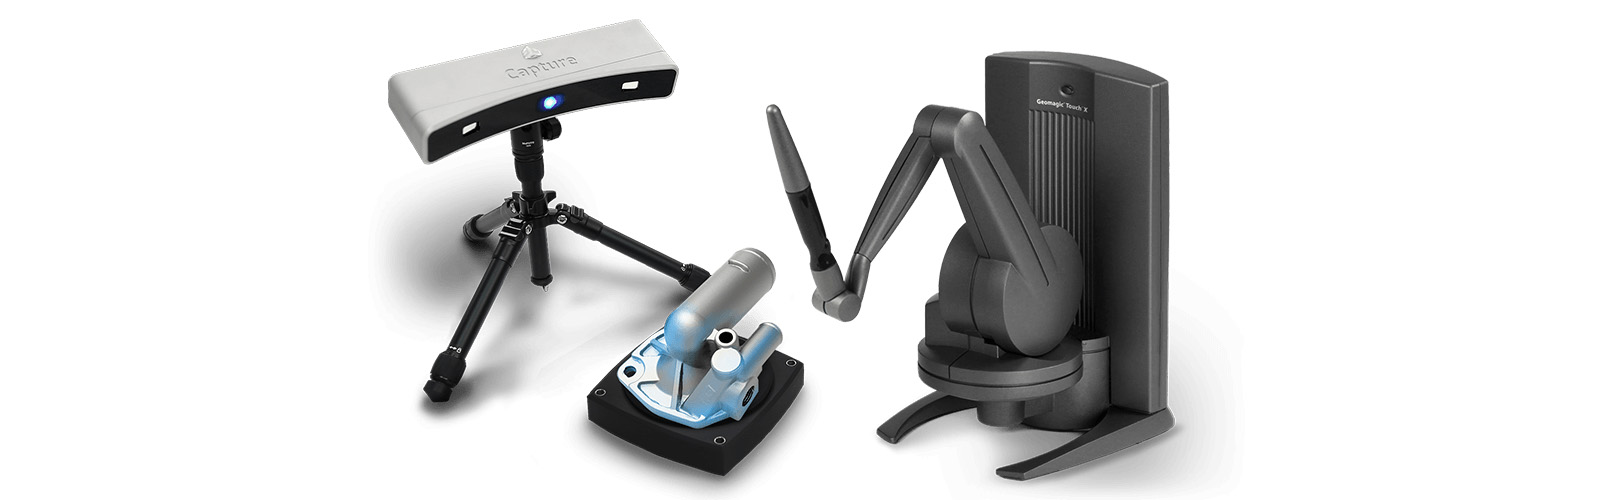
In today’s hypercompetitive environment, companies can’t afford to lag behind when it comes to the quality of their products—or the tools and technologies they use to ensure them.
The ability to program computers is crucial to almost all modern scientific experiments, which often involve extremely complex calculations and massive amounts of data.
The U.S. Department of Commerce announced that the 2018 Malcolm Baldrige National Quality Award will be given to two educational institutions, an organ donor group, a hospital, and a project management firm.
In this episode we look at lessons learned (or not) from GE, the difference between ISO and FDA “requirements,” and this year's Baldridge recipients.
The frequently referenced learning pyramid asserts than an average student retains 75 percent of information learned through practice, compared to just 5 percent of what he hears in a lecture.
This Thursday, for the first Thanksgiving in decades, I won’t be watching football, drinking beer, and stuffing myself into oblivion. Instead, I’ll be serving the homeless, giving clothes, and making myself useful.