Social Sharing block
We are one year away from the 100th anniversary of the creation of the control chart: Walter Shewhart created the control chart in 1924 as an aid to Western Electric’s manufacturing operations. Since it’s almost prehistoric, is it now time to leave the control chart technique—that started out using pen and paper—to the past? Or, in this digital era, is the control chart still relevant to enable manufacturers to improve their competitive position by improving quality and productivity, and reducing waste?
|
ADVERTISEMENT |
Read on to see the story of two plants. Some key words to look out for:
• Predictable process
• Actionable insights
• Improvement
• Cost savings
• Waste
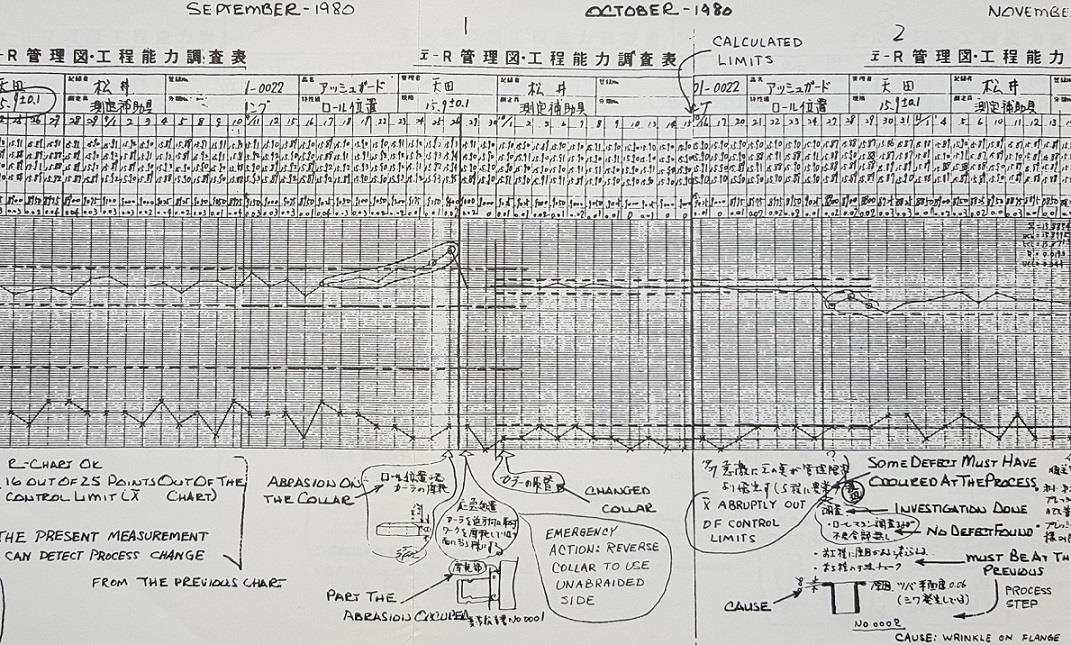
The annotated control chart above is from the Tokai Rikka plant in Japan more than 40 years ago.
…
Comments
Control Charts: Are they still relevant in manufacturing Part 2.
G'day Scott and Douglas,
Yes indeed, they ares still used. But as mentioned in Part 1 graphic / image used, the Shewhart Control Chart and at Tokai Rikka have the U/LCL in dotted lines, never full lines as the lines show very well and your process behavior exapmples, it varies.
Secondly and kind of worse is placing the U/LSL lines (Full of course) on the Control Chart. As Shewhart, Deming, Ishikawa, Juran, Wheeler, AIAG "SPC" text told and tell us, Control Charts Economic CL - dotted; Histogram U/LSL - Full.
How the process behavs then and subsequent capabilities can be so determined meaning Stability before Capability.
My joy was seeing little Ishikawa Basic C&E Diagrams on the Clayton Melbourne Australia, Opama Japan and Smyna Tenn USA NIssan Plants and vehicle Control Chart "Outliers" and then again in the Toyota Hi-Ace plants, using CC and HIstograms as I stated.
When the process was really unstable they showed me very well, Dr IShikawa's 3rd Type of Cause Analysis (Introduction to QC ~1962) the Process Classification Cause & Effect Diagram. As all work happens through a process, it is very useful.
Another joy is seeing CC used in banks, insurance companies and in defense procurements / supply charts. As Mr Toyoda and his engineers told the Cadilac VP after they toured the robot Cadliac line and she presented and told us the story at the Quality Conference in Canada. He queried her on solving problems and so few people to solve them, plus so many robotocs etc. He said that if you do not control your processes, with your people, 'I fear you will only make what you do, badly, quicker'. GM had to write-off so much of their then Captial Investment.
Other uses of SPC
Hi Mike, Doug and I know that control charts have great potential outside of manufacturing - thanks for reinforcing this in your comments.
A huge risk for control charts and their potential to add value to Operations isn't whether the control chart limit lines are dotted or not but whether they are confused with spec limits - the old story of confusion around the voice of the customer and the voice of the process.
SPC - Smart Performance Charts
Shewhart charts have been around for 100 years. Why aren't they used everywhere? Based on my analysis of 1,000s and of improvement posters over the last eight years, it's because Excel line and bar charts are too available. They still represent 75-85% of improvement poster charts.
But control charts are so useful, everywhere. Ryan on my staff uses them to track email delivery rates and PPC (Pay Per Click) performance to save money and increase conversions and open rates. Nurses use them to track patient falls and medication errors. They're not just for manufacturing (a common misconception/excuse).
As you point out, Shewhart called them "Control" Charts. And no one likes to be controlled. Dr. Wheeler calls them process behaviour charts.
I know it's almost impossible to change jargon, but I got to thinking: Everyone wants to improve their performance--golf scores, walking/running steps, etc. What if we called them "performance" charts?
And since they went to college and took statistics, why not "Smart Performance Charts" or SPC?
When I learned SPC 30 years ago, we did charts by hand. Frankly, I knew it would be next to impossible to get people in the phone company to use them. Now it can be done easily and accurately with affordable SPC software. Automation to the rescue.
We have to stop admiring the problem, buy some software and start improving performance across every industry. Let's create hassle-free healthcare, a hassle-free world.
SPC charts
Thanks for the comments and observations. Great you are also an advocate. We didn’t use the word “smart” but this word is inherent to this article and how it proposes to use data and people’s time and energy.
Our focus in this series to date is manufacturing but we know great uses exist outside this narrow focus area. We might squeeze an article in on a different topic before the series reaches its end.
"Excel Line and Bar Charts
"Excel Line and Bar Charts are too available"...
This is true, but there is an increasing trend in usage of the JMP software package (www.jmp.com).
JMP is primarly a desktop tool but there is also a private/public cloud version as well (see demo at public.jmp.com)
In fact, the authors used JMP to produce the charts we see in Parts 2,3 and 4 of this article!
almost always
Great article - I wish I had wrote it first! I see these same tampering and missed signal errors with almost every client. They are bent on finding an easy quick automated way to do this - but mis the learnings that you share. Great job. Shehart and Deming, I think, would agree. Leaders put dots on paper....
Still a place for the 'old'
Thanks, Tim, for the note and for confirming you still see a valued place for this under-used approach to working with data and processes. Hope too you see similar value in the articles we still have to come in this series.
Control charts
Great article! Thank you,
PB
Pierre's comment
Thanks!
Add new comment