Social Sharing block

(maxiQ: Sydney) -- What if your statistical software guided you through your analysis to help you reach solid results? That’s the idea behind maxiQ, a new suite developed by Anthony Burns and Donald J. Wheeler, which contains more than 50 tools.
|
ADVERTISEMENT |
Ask Google why lean Six Sigma (LSS) projects fail and you’ll get a long list of explanations. A perennial favorite is “lack of management support,” even though senior management is usually the main audience for LSS programs. Another is “inadequate training,” although belt training can run to weeks and cost as much as $15,000.
What these explanations rarely consider is the software practitioners use. Errors in application and misleading features in statistical software can undermine a project before it starts. Thus, faulty thinking engendered by software needs to be added to the list of reasons for LSS failures.
It’s estimated there are more than 2.5 million LSS practitioners worldwide, about half of them green and black belts. Roughly 80% of those use statistical software. About $11.3 billion will be spent on statistical software this year, 40% of it in areas related to process improvement. Yellow belts typically rely on Microsoft Excel. Green and black belts mostly use stand-alone statistical packages costing up to $2,400 per person per year.
With so many people depending on software, the software needs to be easy for those without degrees in statistics to use correctly. Unfortunately, many legacy statistical packages include features and defaults that can mislead users, resulting in inappropriate analyses and incorrect results. This places practitioners at a disadvantage.
Like other packages, maxiQ includes the familiar tools and techniques. Unlike other packages, which assume the user knows how and when to correctly use the various techniques in the grab-bag of statistics, maxiQ provides guides and caveats. The guides steer the user to appropriate techniques that have been proven in practice and which emphasize simplicity and clarity over complexity. Appropriate techniques lead to solid results, which lead to taking the correct actions. The caveats define conditions which undermine various techniques so the user can avoid those pitfalls that lead to erroneous results and incorrect actions. Since the key to success is insight, the emphasis throughout is upon helping the user find the quickest way to gain the needed insight.
Normality plots
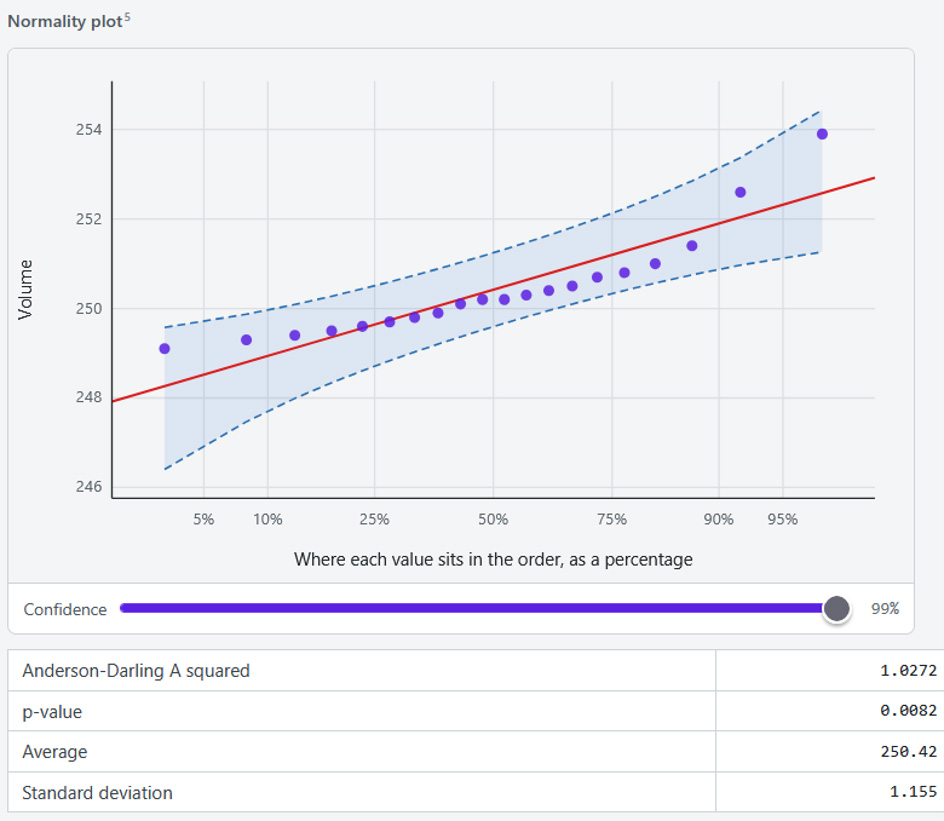
Many people have been taught to start their analysis with a normality plot, and so maxiQ includes this technique. In addition, maxiQ gives you a slider to use to view the plot with various confidence bands around the fitted normal distribution. While some techniques in common use are sensitive to non-normality, the majority are robust to distributional assumptions. MaxiQ tells you which techniques are which. This will allow you to simplify some analyses and avoid pitfalls with others.
Control charts
Control charts (process behavior charts) are primary analysis techniques. MaxiQ includes charts for individual values, average and range charts, and specialty charts for binomial counts and Poisson counts. In addition, maxiQ includes EWMA charts and Cusum charts for those who might have a need for these more complex techniques. With guides for when to use each chart, and with suggestions on how to create effective charts, maxiQ helps you find the right chart for your analysis.
Control charts are sequential procedures where new data can be added without having to recompute the limits. To facilitate this, maxiQ allows the user to set the baseline periods to compute limits. MaxiQ also allows additional baseline periods to be established following known process changes. Baselines for limits may be set to avoid periods of known instability.
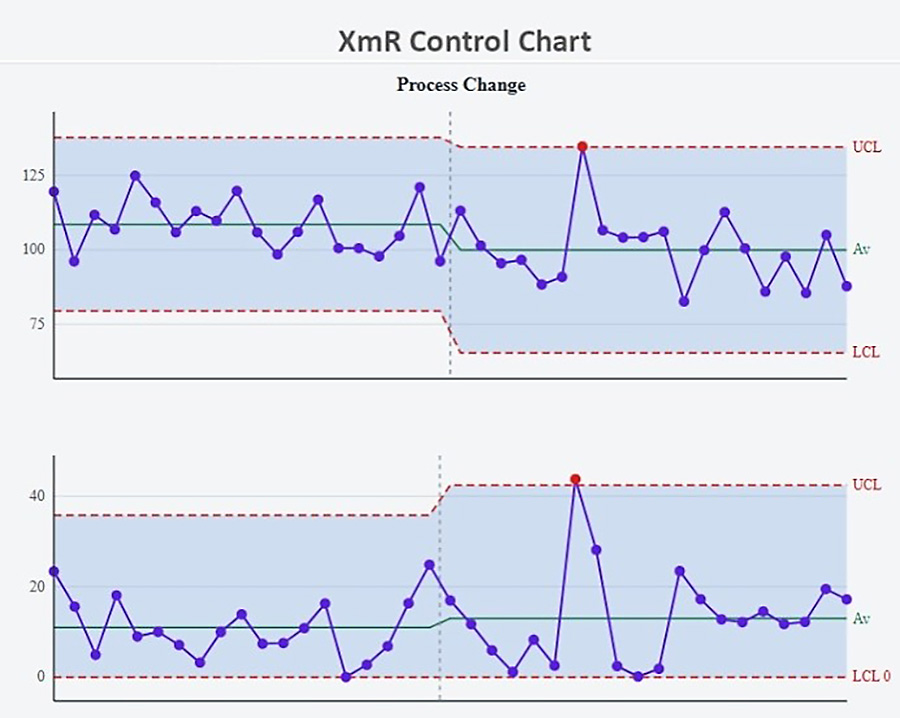
Since a point outside the limits is sufficient to detect virtually all of the interesting signals, maxiQ defaults to using this detection rule. The remainder of the Western Electric zone tests are available as an option for those wishing increased sensitivity for detecting smaller shifts.
Homogeneity
Most classical techniques of statistical inference make an explicit assumption of homogeneity for the data. MaxiQ warns you when these assumptions are critical, and provides a simple test for homogeneity. While the ultimate test for homogeneity is a process behavior chart, the Ramirez-Runger test is a quick way to detect a lack of homogeneity. This simple test can save the user from getting spurious results and taking incorrect actions.
Normalization
The black hole of data analysis is the use of nonlinear transformations to make the histogram “look more normal.” Good analysts know that the outliers are the signals we want to detect rather than being problems to remove. Normalization will hide these outliers and corrupt your analysis. Asking whether your histogram needs to be normalized before you know whether the data are homogeneous is premature. All probability models require homogeneity. While normalization may hide a lack of homogeneity and make your histogram look more mound-shaped, it cannot cure the problem that the lack of homogeneity represents. However, for those who might feel they have a legitimate reason to normalize their data, maxiQ includes a normalization button—along with a warning not to use it unless you know what you are doing and why you are doing it.
Histograms
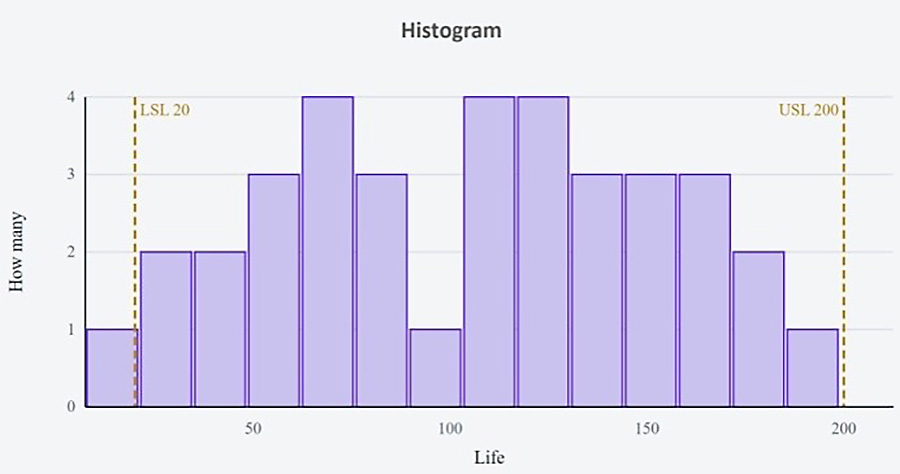
Many statistical packages, reflecting a preoccupation with normality, draw a normal curve over the histogram. Because that curve shows an assumed model rather than the data, it’s what Edward Tufte calls “chartjunk”: ink that adds nothing to what the data show. The idea that a few dozen, or even a few hundred data might have tails that look like a normal distribution is a triumph of imagination. To test for a lack of fit out to ±2.95 sigma with a chi-square lack-of-fit test requires 3,200 data. Long before you’ve collected that many data, your process will have changed. Moreover, the chartjunk bell-shaped curve can distract you from the story told by the histogram. For this reason, maxiQ does not impose a curve on a histogram. Instead, it includes a slider that changes the bin width. By adjusting the slider you can see the characteristics of your data, such as the overlapping histograms of the figure. Here we immediately suspect the data to be a mixture of data from two different processes.
Capability
Because conformance to specifications is so important, people have been creating confusion with capability indexes for more than 40 years. While index numbers are useful, they require interpretation. Using sound mathematics and realistic first-order approximations to an excess cost function, maxiQ converts the four capability and performance indexes into effective costs of production and use. These effective costs of production and use characterize the actual cost of production and use as a multiple of the nominal cost of production. By dealing directly with costs, these values are easy to interpret. By considering the effective cost for various operational situations, these costs provide a way to estimate the savings for various improvement schemes.
Thus, maxiQ converts your capability and performance indexes into numbers you can use to decide which projects to work on.
Experimental studies
MaxiQ also includes the traditional statistical techniques developed for use with experimental studies. These include descriptive statistics, t-tests, ANOVA, chi-square test, Mann-Whitney test, and the Kruskal-Wallis test. For designed experiments, maxiQ includes color 3D graphs of results. To help the user navigate these techniques, each includes a guide that explains the assumptions behind the technique, the conditions needed to use the technique, and the ways to interpret the results of the technique.
Six Sigma capability confusion
As soon as capability ratios were computed, people wanted to know what they meant in terms of the fraction nonconforming. In the Six Sigma propaganda, there was an early assumption that you should allow for a 1.5 sigma shift when computing infinitesimal values under the extreme tails of an assumed probability model. All this did was add to the confusion surrounding capability by adding the so-called sigma levels for a process.
The reality is that we simply cannot extrapolate out beyond the tails of our histogram to compute meaningful infinitesimal levels of nonconformity. (Information theory tells us that zero counts contain no useful information.) As a result, virtually all defect levels expressed in parts per million are wrong. Always have been. Always will be.
Moreover, the assumption that process shifts never exceed ±1.5 sigma has no basis in reality. Real processes can shift much further, so even the inflated defect levels in “process sigma” tables understate what an unpredictable process can produce.
Rather than playing with funny numbers, maxiQ converts capabilities into effective costs of production and use. Since the integrals used in these computations use the whole distribution, rather than just the extreme tails, they are much more robust and useful than imaginary sigma levels taught in Six Sigma classes.
Innovation
MaxiQ innovates where it matters. It provides all the traditional statistical methods, but users gain the most by focusing on basics such as process mapping. For example, a small team at a public records office saved $1 million a year using an early version of the maxiQ process mapper. Team members had basic training and no belt certificates, and they used the mapper to redesign how they worked. MaxiQ makes mapping easy, with standard and extended symbols, automatic shortest-route finding and line routing, and a logic checker that helps keep maps accurate.
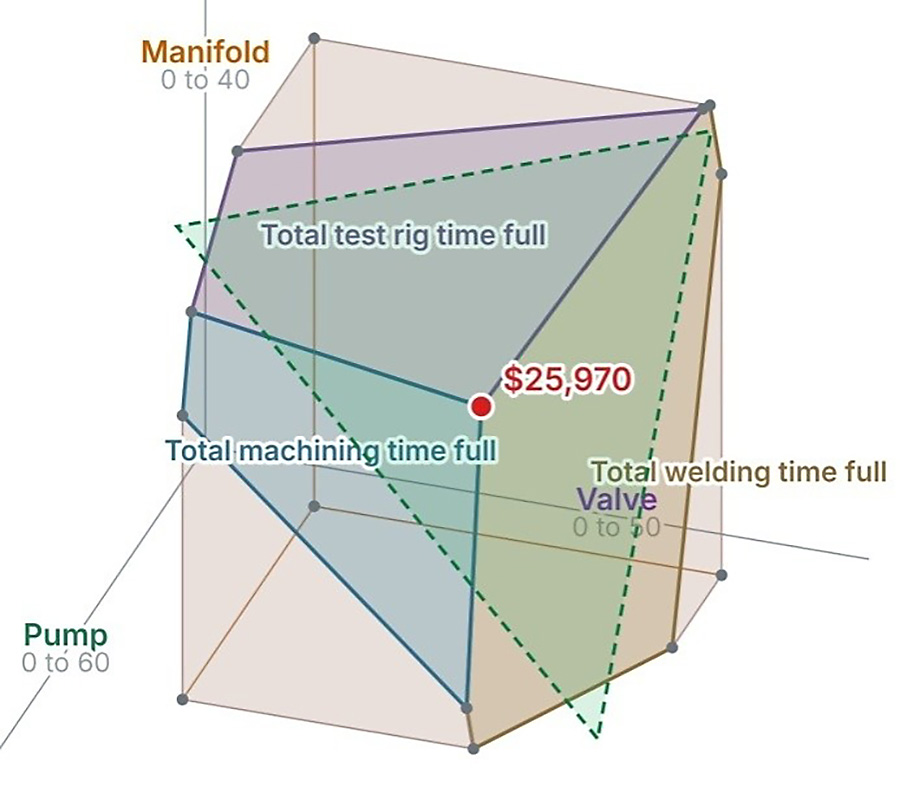
Resource allocation—assigning people, time, materials, equipment, and other assets to maximize an objective such as profit or production volume—is a critical part of any project or business initiative. MaxiQ is one of the few statistical packages to address it. It can optimize any number of variables under any number of constraints. The image shows three quantities being adjusted to maximize profit.
AI guide
General-purpose AI tools such as ChatGPT and Google’s AI answers are indiscriminate; they favor quantity of information over quality. Ask Google about DMAIC, for example, and it may tell you that “DMAIC is a deeper, more rigorous framework designed for complex, chronic, or data-heavy problems.” Follow the cited source, and it turns out to be a marketing blog, not process improvement expertise. Users who rely on answers like that can easily be misled. By contrast, maxiQ’s AI guide is custom-built from millions of words written by process improvement experts.
Summary
Without honest, accurate statistical software, lean Six Sigma projects start at a serious disadvantage. MaxiQ gives companies a solid foundation for success.
Receive a 20% Christmas discount on maxiQ by using discount code QUALITYDIGEST2027 at www.maxiQstatistics.com. Offer good until Jan. 1, 2027.
Add new comment