{domain:"www.qualitydigest.com",server:"169.47.211.87"} Skip to main content

        
User account menu
Main navigation
  • Topics
    • Customer Care
    • Regulated Industries
    • Research & Tech
    • Quality Improvement Tools
    • People Management
    • Metrology
    • Manufacturing
    • Roadshow
    • QMS & Standards
    • Statistical Methods
    • Resource Management
  • Videos/Webinars
    • All videos
    • Product Demos
    • Webinars
  • Advertise
    • Advertise
    • Submit B2B Press Release
    • Write for us
  • Metrology Hub
  • Training
  • Subscribe
  • Log in
Mobile Menu
  • Home
  • Topics
    • Customer Care
    • Regulated Industries
    • Research & Tech
    • Quality Improvement Tools
    • People Management
    • Metrology
    • Manufacturing
    • Roadshow
    • QMS & Standards
    • Statistical Methods
    • Supply Chain
    • Resource Management
  • Login / Subscribe
  • More...
    • All Features
    • All News
    • All Videos
    • Training

The 20% Tax: Why You Can’t Inspect Your Way to Quality

Stop looking at problems and start preventing them

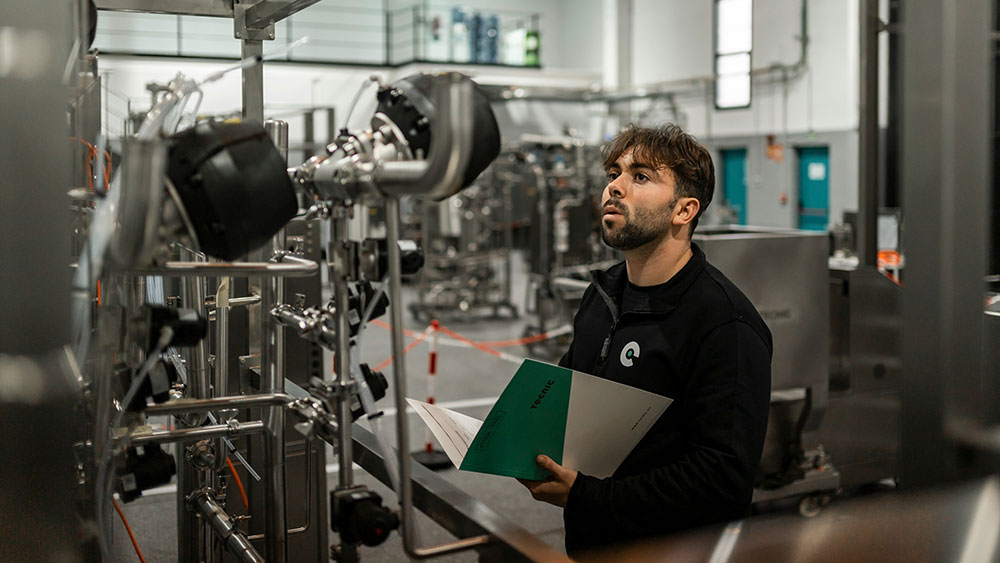
TECNIC Bioprocess Solutions / Unsplash

James Glover
Bio

Flint Learning Solutions

Mon, 08/31/2026 - 12:02
  • Comment
  • RSS

Social Sharing block

  • Print
Body

At a typical manufacturer, the cost of poor quality runs to 15–20% of sales. Shellye Archambeau, a Quality Digest contributor, once put a face on that number: A $250 million company added up its repair, rework, scrap, warranty, and write-off costs, and found they equaled 20% of sales. That’s one full day of every five-day week spent making scrap—about $200,000 a day.

ADVERTISEMENT

Most plants try to shrink that number with more inspection. Problem is, that’s the most expensive way to buy quality; inspection only finds defects after the money to make them has already been spent. If more inspection reliably fixed quality, the problem would have been solved decades ago.

Where the money actually goes

The cost of quality breaks into four buckets.

Prevention: This is the cheap bucket that carries things like training and practice, mistake-proofing a fixture so a part can’t seat backwards, and keeping equipment maintained.

Appraisal: The cost of inspecting and checking for defects—incoming inspection, in-process gauging, final QC, calibration.

Internal failure: The scrap, rework, and sorting caught before shipment.

External failure: The warranty claims, returns, recalls, and lost accounts caught by the customer.

Failure is where the real money burns, and it’s the hardest to see. ASQ’s 2025 cost-of-quality research found that only 31% of quality professionals fully understand how quality costs hit their organization’s financials.

The 1–10–100 rule, codified by George Labovitz, Yu Sang Chang, and Victor Rosansky in Making Quality Work (HarperCollins, 1993) captures the pattern as a rule of thumb: about $1 to prevent a defect, $10 to catch and correct it inside the plant, $100 once it reaches the customer. The exact multiples are illustrative, but the direction isn’t in dispute. Yet budgets and daily attention still cluster around appraisal—finding defects after they already exist, rather than prevention—which means changing what happens at the moment a defect would be created.

In other words, most plants are focused on the $10 solution instead of the $1 solution. The plants spending the most on quality are often putting it in the wrong bucket, adding inspectors and checkpoints to catch defects when better behavior at the source would have stopped them from happening at all.

Inspection finds defects, but it doesn’t prevent them.

The behavior behind the defect

On the floor of almost any plant with a quality problem, operators can recite the standards and still skip them under pressure. The reasons vary, and the small lapses add up: the in-process verification that gets initialed but not performed; the deviation that gets rationalized under shift-change pressure; the calibration check that gets a shortcut when the line is behind.

That gap between knowledge and action lives in the flow of work, under real conditions, when the schedule is tight and no one is watching. It’s a behavior problem, not a knowledge problem, and documentation can’t close it. A binder full of perfect SOPs still sits one decision away from a defect if the behavior at the machine doesn’t hold.

First-time quality is a habit

Prevention, in practice, is a set of habits: the operator who runs the check every time; the team lead who catches drift before it becomes scrap; the setup that gets verified before the run starts. Habits don’t come from instruction. They come from repetition in context.

Research on how habits form shows what team leads and supervisors see all the time: A behavior becomes automatic only after weeks of consistent practice on the line. That’s the opposite of how quality training usually runs, with an intensive session, then months of nothing, then a refresher after the next escape.

Plants that actually reduce the cost of poor quality (COPQ) move the practice into the workflow. Instead of pulling team leads off the line for classroom sessions, they build short, specific practice into daily work so the learning happens on the job where the behavior lives. A quality check becomes a practice rep. A verification step becomes a habit in formation. The goal isn’t to teach the standard again. It’s to make following it automatic.

Measuring the behaviors that prevent defects

Most quality programs go wrong when they measure the defects instead of the behaviors that cause them. To be fair, it’s a lot tougher to measure behaviors than defects. Still, scrap and rework tell you the damage after it’s done. To prevent it, you have to measure whether the preventive behaviors are actually happening.

That means tracking behavior change after team leads have completed a series of practice reps over several weeks. Did they really develop new habits? The change is measurable in a few ways.

Self-assessment: The team lead rates the specific practices at the start and again several weeks later.

Manager assessment: The manager independently completes the same before-and-after assessment, so two readings corroborate each other (instead of relying on self-report alone).

Milestone validation: At set points in the program, the manager confirms the behavior change is visible in real work before the team lead advances to the next level.

Then tie those behaviors to the quality metrics they drive: first-pass yield, scrap rate, escapes. When a plant can show that a specific practiced behavior moved a specific quality number, prevention stops being an abstraction and becomes the most effective money the plant will ever spend.

The cost of poor quality isn’t a tax you’re required to pay. It’s the price of the gap between what operators know and what they do under pressure. Inspection will never close that gap, because it works after the fact. Prevention closes it, and prevention is a habit. Build the habit, and the number finally moves.

Add new comment

The content of this field is kept private and will not be shown publicly.
About text formats
Image CAPTCHA
Enter the characters shown in the image.

© 2026 Quality Digest. Copyright on content held by Quality Digest or by individual authors. Contact Quality Digest for reprint information.
“Quality Digest" is a trademark owned by Quality Circle Institute Inc.

footer
  • Home
  • Print QD: 1995-2008
  • Print QD: 2008-2009
  • Videos
  • Privacy Policy
  • Write for us
footer second menu
  • Subscribe to Quality Digest
  • About Us