
Dirk Dusharme/Adobe
Social Sharing block

On April 2, 2026, the U.S. Food and Drug Administration issued a warning letter to Purolea Cosmetics Lab, reference 722591-04022026. By now, most of you have heard the story. The company had used AI agents to write drug product specifications, procedures, and master production records. No qualified person reviewed them. When investigators asked why the firm had distributed product without process validation, the answer was that the AI agent had never mentioned it was required.
|
ADVERTISEMENT |
The FDA cited 21 CFR 211.22(c) on quality unit responsibility and 21 CFR 211.100 on production and process controls, the clause the FDA reaches for when process validation is missing, and made the point plainly: You can’t delegate compliance to a tool.
That case is easy to read and feel comfortable about; somebody let a chatbot write their master batch record. Your organization would never do that. The failure I want to talk about is quieter, and I think it’s more common. This is about a specific kind of failure: AI model drift. It’s what happens when a validated, properly reviewed model keeps producing confident, formatted, on-time outputs that are slowly and quietly wrong, because the world it was trained on has moved on, and nobody built a way to notice.
Below is the case that taught me to watch for it, the five signals I monitor with real thresholds attached, and the response ladder I use once one of them fires—so you have something to act on before your organization finds out the hard way.
Why drift is a different animal
Most quality professionals have spent their careers with systems that fail loudly. A sensor dies. A server drops. A calculation throws an error, and somebody gets an alarm. Our whole incident culture is built on the assumption that failure announces itself.
A machine learning model doesn’t work that way. It keeps producing an output for every input you give it, at the same speed, in the same format, with the same confidence bar on the screen. The output just gradually stops matching reality.
The causes are ordinary. Your supplier changed a raw material. You commissioned a new line with different equipment. Your operators got better at a step, so the defect mix shifted. Seasonality moved your humidity range. None of these is a fault. All of them move the world away from the data the model learned on.
Figure 1 is the shape of the problem. Every system-health metric you monitor stays flat and green for the whole year. Accuracy walks downhill the entire time, until it crosses the acceptance criterion you signed at operational qualification (OQ), the stage where you demonstrate the system performs as specified. The distance between those two lines is the part your dashboard was never built to show you.
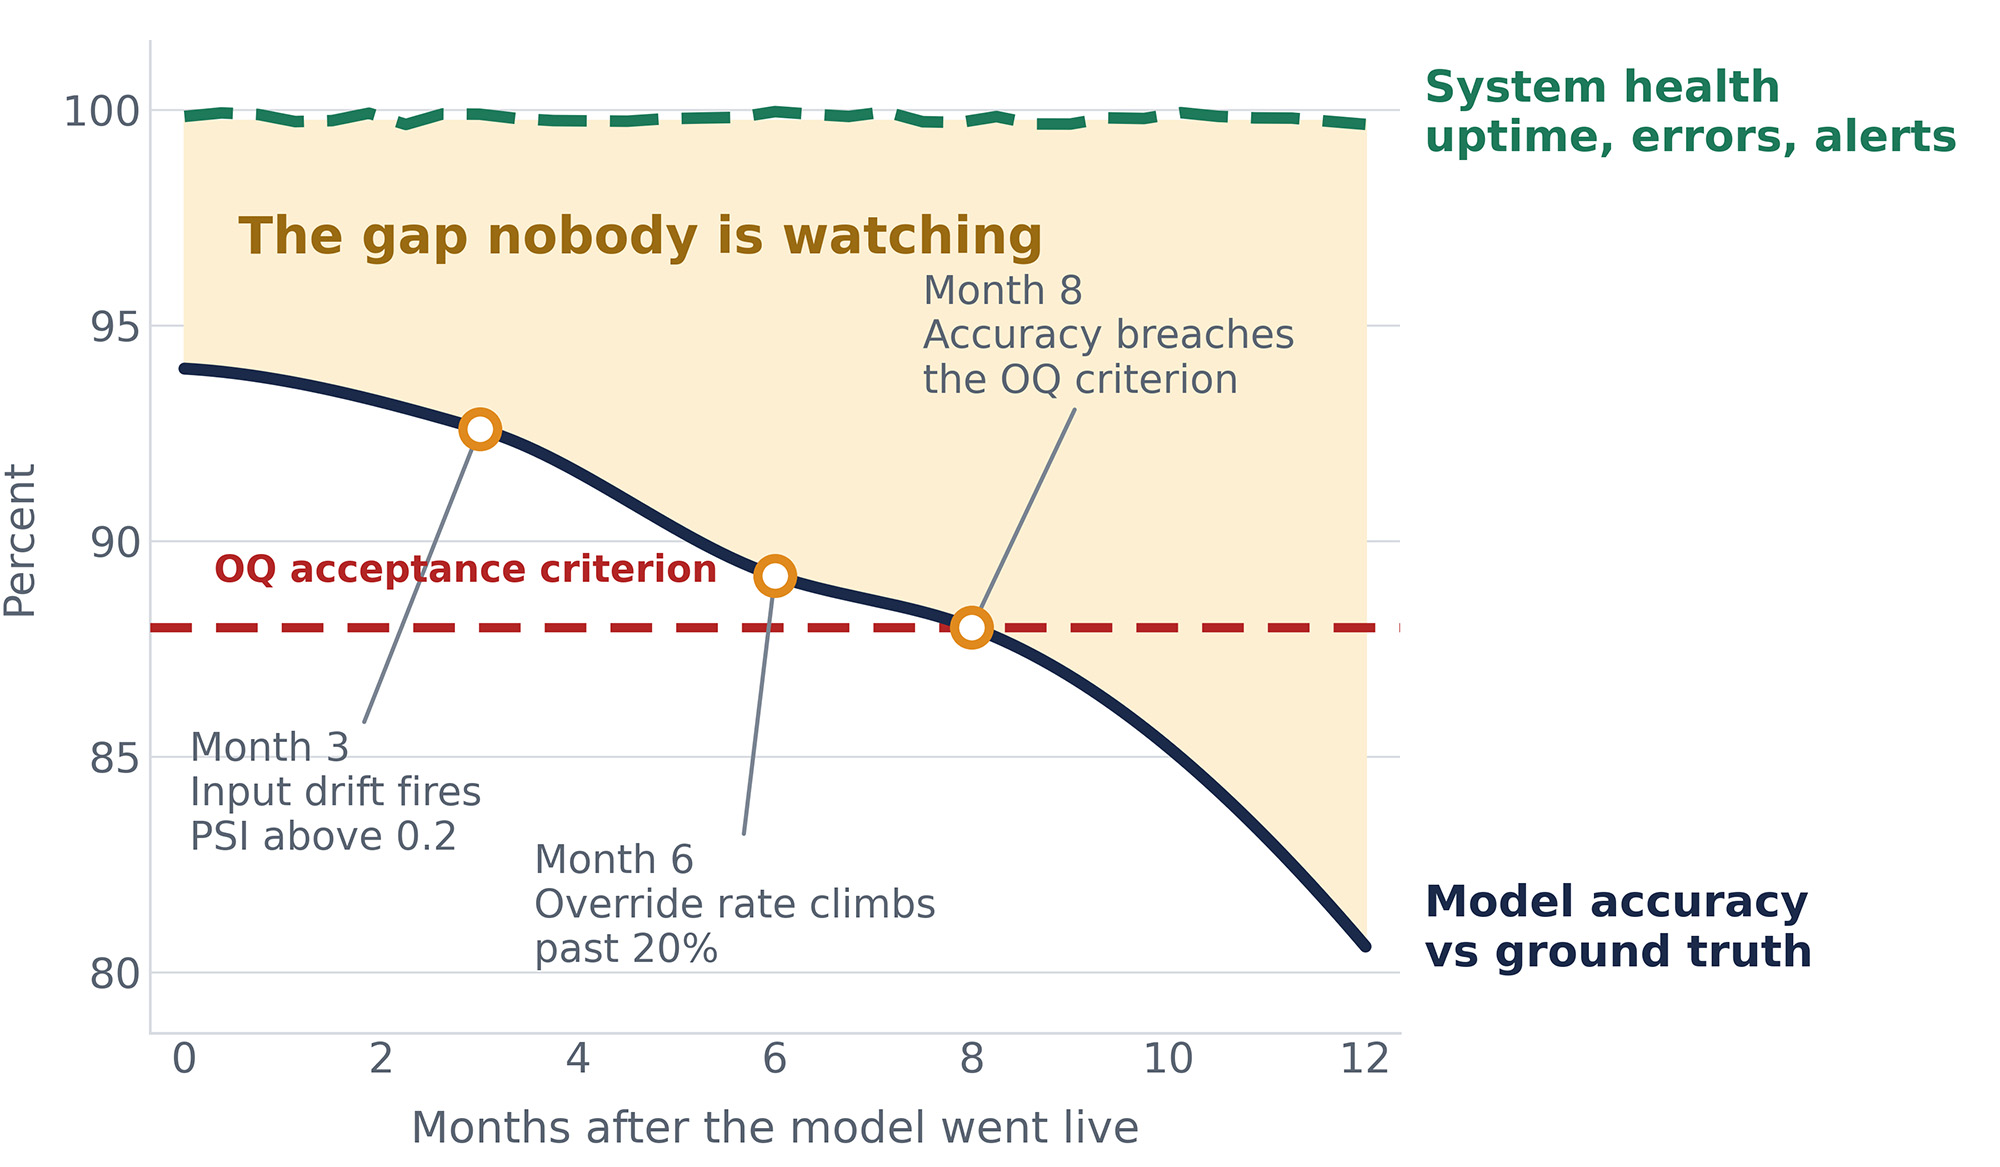
Figure 1: The silent gap: Every system-health metric holds flat for 12 months while model accuracy walks downhill, crossing the operational qualification-acceptance criterion at Month 8. Markers show where input drift, override rate, and performance would each have fired. This is illustrative, drawn to show the shape of the failure rather than data from any one site.
The case I keep coming back to was a deviation-management assistant at a client engagement of mine, details anonymized. It was a tier-two system in the risk model I use, advisory only: It classified deviations and proposed CAPAs, and a human made every decision. Each time our reviewers finalized a record, we fed the result back to the agent to learn. The outputs grew smarter, then nearly perfect, and that’s where the trouble started. People became complacent and began pasting the suggestions in as-is.
What nobody saw was that deviations coming from one site were of a different nature, and they were quietly corrupting the classification and risk metrics. What caught it wasn’t a dashboard. It was our secondary review, a random-sample check, which flagged that the outputs weren’t what they should be. The drift had been running for 14 days. We paused the agent and reviewed everything back to the last known-good point: 64 deviations wrongly categorized, and not one challenged by the humans reviewing them. We reverted every one under full change control, raised a deviation on the deviation process itself, and retrained the team so nothing enters the system unreviewed.
Regulators have noticed
The direction of travel is consistent across jurisdictions.
The FDA finalized its Computer Software Assurance guidance in September 2025, pushing validation effort toward the functions that carry the most risk and away from documentation for its own sake. It’s guidance, not regulation. It was written for medical device production and quality system software, but its logic travels well into any regulated manufacturing setting.
In Europe, draft Annex 22 to the GMP guidelines deals specifically with AI. It’s still a draft. Consultation closed in late 2025, and finalization is anticipated during 2026, though the publication date and any enforcement timeline remain uncertain. So treat it as direction. It’s not yet law.
Two things in it matter here. Models with fixed parameters are acceptable in critical applications. Models that keep learning during live use are excluded from them. And the draft expects you to detect when a model’s input distribution has shifted, and to trigger revalidation when it does.
Under that rule, my deviation assistant, which kept learning in live use, could never sit in a critical application. It was permitted only because it was advisory, with a human owning every decision. My story shows what that human layer is worth once reviewers stop reading.
Read that last expectation carefully. It assumes you are measuring the input distribution in the first place. Most teams I meet are not.
Five signals worth watching
Monitoring is where good intentions turn into arguments about what to measure. Figure 2 sets out the five signals I put in a monitoring plan, the thresholds I use, and where the data usually already sit in your systems.
Before the numbers, here's the honest caveat: These are illustrative starting points, and no regulator has endorsed any of them. The Population Stability Index bands trace to Siddiqi’s work in his book, Credit Risk Scorecards: Developing and Implementing Intelligent Credit Scoring (Wiley, 2015), where 0.10 and 0.25 mark minor and major shifts. They are a rule of thumb rather than a significance test. The override band is a practitioner default I’ve found useful. Calibrate all of it to your own baseline and risk tier, and write down why you chose what you chose. The rationale is the part an auditor reads.
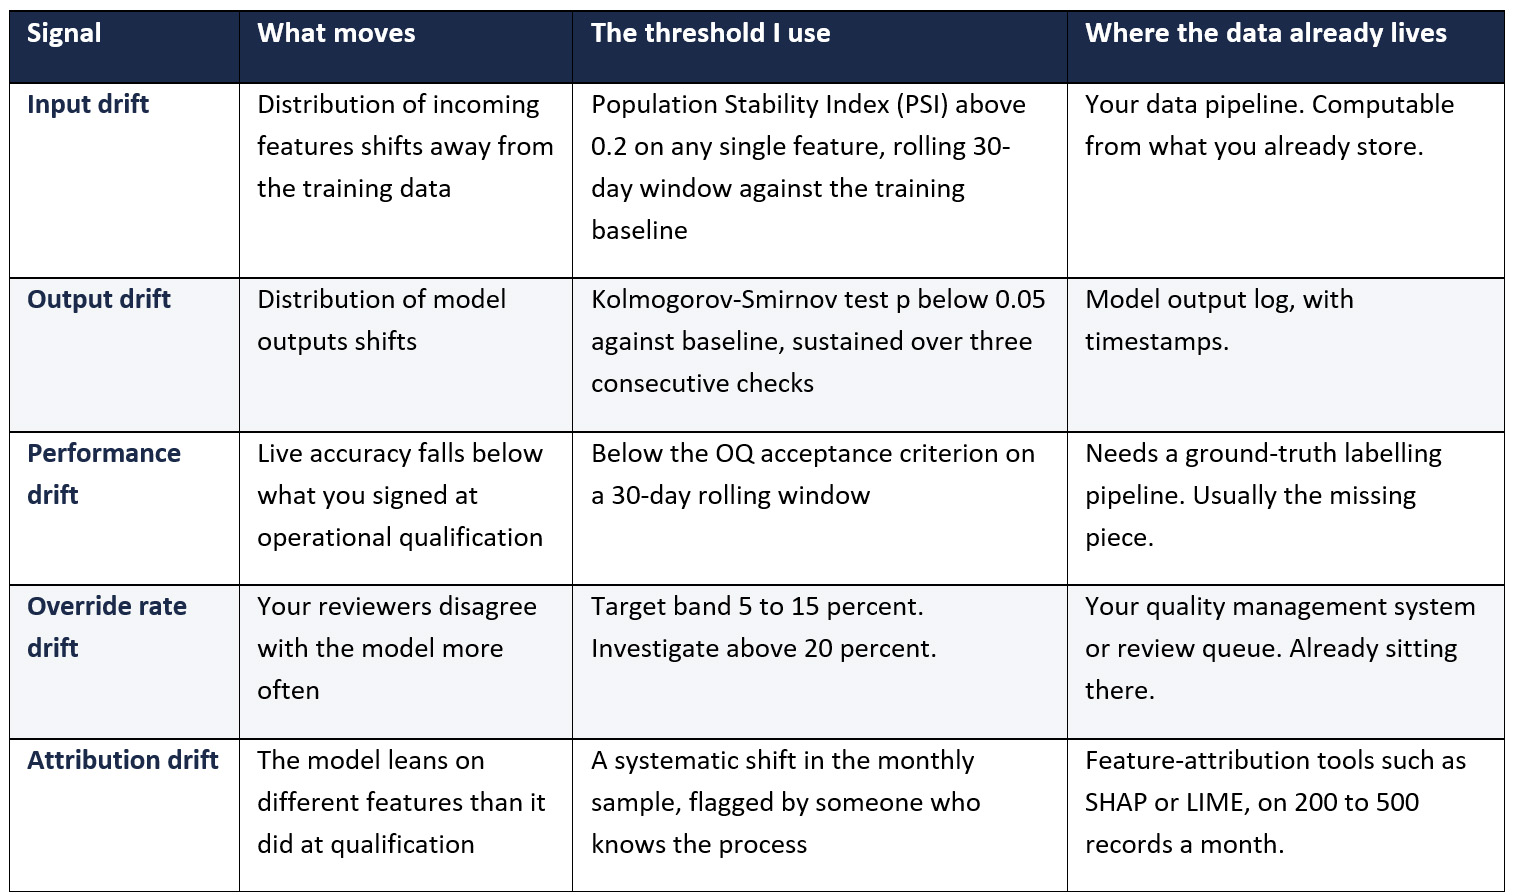
Figure 2: Five drift signals, the thresholds I use, and where the data already live. Thresholds are illustrative starting points, not regulatory limits.
Two of those five signals deserve a comment.
Performance drift is the most direct measure and the hardest to run, because it needs ground truth. If you can’t label outcomes, you can’t measure it. Say so in your monitoring plan rather than leaving the gap silent, and lean harder on the other four.
Override rate is the cheapest signal on the list, and almost nobody tracks it. Your reviewers usually notice a model going wrong months before your statistics do, and the override log is where that knowledge is already sitting. While you’re in there, look for the opposite problem, too. In my experience, a zero override rate across thousands of transactions rarely means the model is perfect. It usually means your reviewers have stopped reading.
What you do when a trigger fires
An alert with no agreed-on response is an alert people learn to close. The ladder below is what I put in the SOP so that the action is decided before anyone is under pressure.
Rung 1—Alert: One metric crosses its threshold, but performance and override rate is still inside bounds. Log it, notify the named model owner, and give the investigation a week.
Rung 2—Investigate: The alert is confirmed. Structured root cause analysis by a data scientist with input from someone who knows the process, two to three weeks.
Rung 3—Restrict scope: The cause is local—say, one product family or one line. Route that subgroup to manual review and formally amend the model’s intended use. The model keeps working where it still works.
Rung 4—Suspend: The cause is systemic, or it touches a high-risk subset you can’t carve out. Records go back to the legacy process. Raise it as a major change.
Rung 5—Retrain: New training data, and full revalidation through operational and performance qualification. Budget eight to 16 weeks, and treat it as a major change event, not a patch.
The point of naming five rungs is that most drift doesn’t deserve Rung 5, and teams without a ladder tend to bounce between ignoring the problem and shutting the system down.
Where to start, without a budget
Here are four actions, in order, and none of them needs a budget approval:
1. Pull your override log for the last quarter. If you have a human-confirming model output anywhere, that log exists. Plot the rate by month. If it’s climbing, you’ve found your first drift signal, and it cost you an afternoon.
2. Write down your training baseline. Which dataset, which date range, which population: If nobody can answer that in a week, you have a bigger problem than drift, because you can’t demonstrate what “normal” was.
3. Name one person who owns each model. Not a committee. A person, in writing, who receives the alert.
4. Put one threshold in a document and sign it. Any of the five. A defended number in an approved monitoring plan beats five perfect metrics nobody has agreed on.
The part I feel strongly about
I’ve taken AI-supported quality systems through health authority inspection, and the question that comes up is never whether the model is clever. It’s always some version of, “How would you know if it stopped working, and what would you do?”
I think we’ve imported a habit from software validation that doesn’t survive contact with machine learning. We treat validation as an event with an end date. For a model, the end of validation is the beginning of the thing that actually protects you. A model that was correct in March and wrong in September was never really validated in any sense a regulator will find comforting, because nobody was watching the gap.
Purolea’s mistake was letting a tool make decisions that no qualified person reviewed. Drift is the slower version of the same mistake, and it will find far more organizations than the loud one ever will.
Add new comment