
{domain:"www.qualitydigest.com",server:"169.47.211.87"} Skip to main content

        
User account menu
Main navigation
  • Topics
    • Customer Care
    • Regulated Industries
    • Research & Tech
    • Quality Improvement Tools
    • People Management
    • Metrology
    • Manufacturing
    • Roadshow
    • QMS & Standards
    • Statistical Methods
    • Resource Management
  • Videos/Webinars
    • All videos
    • Product Demos
    • Webinars
  • Advertise
    • Advertise
    • Submit B2B Press Release
    • Write for us
  • Metrology Hub
  • Training
  • Subscribe
  • Log in
Mobile Menu
  • Home
  • Topics
    • Customer Care
    • Regulated Industries
    • Research & Tech
    • Quality Improvement Tools
    • People Management
    • Metrology
    • Manufacturing
    • Roadshow
    • QMS & Standards
    • Statistical Methods
    • Supply Chain
    • Resource Management
  • Login / Subscribe
  • More...
    • All Features
    • All News
    • All Videos
    • Contact
    • Training

Multivariate Charts

When you see how they work, you’ll see why they don’t work

Susan Holt Simpson / Unsplash

Donald J. Wheeler

SPC Press

Mon, 08/24/2026 - 12:03
  • Comment
  • RSS

Social Sharing block

  • Print
Body

Some of my colleagues have recently been pushing multivariate charts. These charts combine several different process outcome values into a single number that’s placed on a chart. Unfortunately, this theoretically elegant approach breaks down in practice for reasons that will be explained here.

ADVERTISEMENT

We shall use the example of Adhesive 442 to illustrate the ideas behind multivariate charts. Each batch of Adhesive 442 is characterized by two key properties, pH and viscosity. Twenty consecutive batches had the values shown in Figure 1.
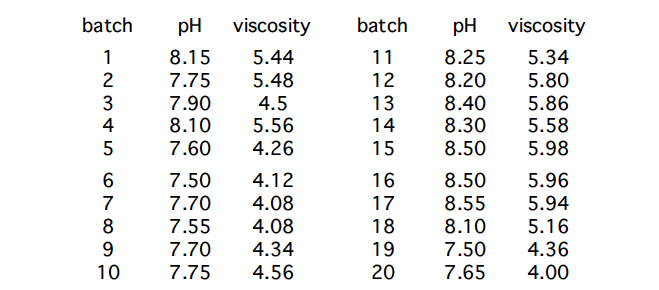

Figure 1: Adhesive 442 data

The average pH for Adhesive 442 is 7.9825. The average moving range for the pH values is 0.221. Based upon this value, the sigma(X) value for pH is 0.196. The XmR chart for the pH values is shown in Figure 2.
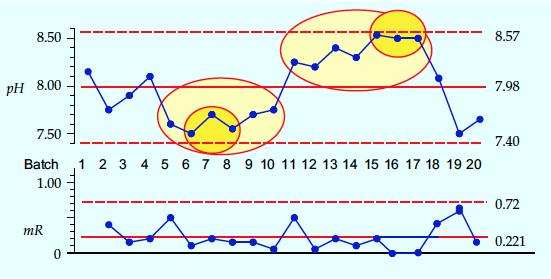

Figure 2: XmR chart for Adhesive 442 pH values

 …

Want to continue?
Log in or create a FREE account.
Enter your username or email address
Enter the password that accompanies your username.
By logging in you agree to receive communication from Quality Digest. Privacy Policy.
Create a FREE account
Forgot My Password
Top Stories
Your First 12 Months of ISO 9001:2026 Transition: An Auditor’s Perspective
Why Remote Work Isn’t Working
Problem Solving and Continuous Improvement Are Not the Same
Run It Past the Murder Board
The Art of Forecasting: Part 2

Comments

Submitted by Bev Daniels (not verified) on Mon, 08/24/2026 - 10:20

Multivariate is not Multi-Vari

These two terms do get confused even by statistical software.  Let’s be clear that the multi-vari chart (as first advocated by Leonard Seder) is a simple uncomplicated graphical study that displays all raw data without any mathematical manipulation.  It is very useful for Problem Solving and I’ve used it as a basis for determining rational subgroups.  It is not the thing that Dr. Wheeler discusses.

  • Reply

Submitted by Donald J. Wheeler on Mon, 08/24/2026 - 14:06

In reply to Multivariate is not Multi-Vari by Bev Daniels (not verified)

Reply for Bev Daniels

Thank you Bev for your comment.  Yes, you are right.  Although somewhat subjective, Multi-Vari plots are based on the same principle as process behavior charts.  They use the power of the graph to make changes visible.

  • Reply

Submitted by Jim L. (not verified) on Fri, 08/28/2026 - 04:20

In reply to Multivariate is not Multi-Vari by Bev Daniels (not verified)

Multi-vari examples?

Where would I find examples of multi-vari charts? Do you have any you can share?

  • Reply

Submitted by dangermoney on Mon, 08/24/2026 - 11:39

<p></p>

  • Reply

Submitted by Sergey Grigoryev on Mon, 08/24/2026 - 12:08

Another brilliant article by Donald Wheeler

The article once again confirms the core principle I follow in my work: the best analysis is the simplest one that provides the necessary understanding of the process.

  • Reply

Submitted by Ekim Recrem (not verified) on Mon, 08/24/2026 - 16:23

www.PBCharts.com

We built an Excel Add-In to make process Behavior Charts and named it in honor of Donald Wheeler. Here is an example of the charts of pH and Viscosity.

See it at https://peltiertech.com/Image removed.pbcharts

  • Reply

Add new comment

Please login to comment.

© 2026 Quality Digest. Copyright on content held by Quality Digest or by individual authors. Contact Quality Digest for reprint information.
“Quality Digest" is a trademark owned by Quality Circle Institute Inc.

footer
  • Home
  • Print QD: 1995-2008
  • Print QD: 2008-2009
  • Videos
  • Privacy Policy
  • Write for us
footer second menu
  • Subscribe to Quality Digest
  • About Us
  • Contact Us