Social Sharing block
Based on some recent inquiries there seems to be some need to review the four capability indexes in common use today. A clear understanding of what each index does, and does not do, is essential to clear thinking and good usage. To see how to use the four indexes, to tell the story contained in your data, and to learn how to avoid a common pitfall, read on.
The four indexes
Four indexes in common use today are the capability ratio, Cp; the performance ratio, Pp; the centered capability ratio, Cpk; and the centered performance ratio, Ppk. The formulas for these four ratios are:
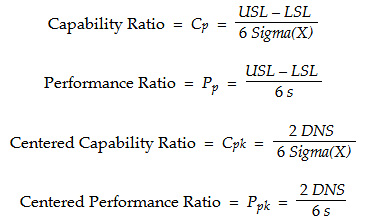
To understand these ratios we need to understand the four components used in their construction. The difference between the specification limits, USL – LSL, is the specified tolerance. It defines the total space available for the process.
…
Comments
Like this article
1) Would it be possible to email this article seperately so that I can digest it more fully? My email is tjohnson9916@charter.net.
2) What do you mean, "operate a process to its full potential?" This is a key term, but I do not leave the article feeling I understand it fully.
Regards,
Tom Johnson
Emailing an article
Full Potential
Trending Capabilities
For a quarterly review I would like to see what the capability of a process is and compare its capabilty to its original validated capability and also see if there is any change in the capabilty quarter to quarter. This is for a high level management overview process. How would you design this metric so that it is meaningful for finding trends?
Why?
Why would you do that? The practice of comparing this quarter to last quarter, and this quarter to the same quarter last year, is poor practice. The old saying still works: "Any fool can make a trend out of two points." Management by fool's trends is a harmful practice. I recommend you look up Don's article on "Avoiding Man-Made Chaos" to see a much better approach.
As long as the process stays in control, these indexes won't change significantly, unless some significant work is done to the system to change its performance. Looking at quarterly numbers, when you have performance this well-defined, is a waste of everyone's time.
Tracking Cpk on a XmR Chart
Well of course it will change each month even if the underlying process is stable (in-control). You can track them (Cpk values) on a XmR chart and if the values remain within the process limits AND the underlying process is in control-nothing has changed. I wrote an article for the STANDARD newsletter (ASQ-MQD) way back in 2000 (Reporting Capability Numbers) that describes this method. I can send you a copy if you like.
Rich DeRoeck
Tracking Cpk on a XmR Chart
Rich,
Would appreciate a pdf copy of your article. Email is sahindle@hotmail.com
Thanks, Scott.
tracking capability indices on a XMR chart
I think the question isn't how to do it, but rather what value do you get out of doing it?
Of course you can track quarterly index numbers on a XMR chart. and it will provide a decent indication of the stabilty of the index. HOWEVER, why would you?
First quarterly subgroups provide only 4 data points per year so to have 'good' control limits one woudl need several years of data.
Secondly, what - really - is the value add? You already have control charts for the process with the appropriate subgrouping so calculating the capability index and then charting them on a control chart is a lot of extra work.
And quarterly values will tend to supress signals and delay the recognition (proof without resorting the natural control chart) that a change has occured - for the better or worse.
In the worst case calculating the indexes themselves can be very misleading if the process is not naturally Normal. (and many are non-normal and non-homogenous, yet capable and stable but these processes tend to substantially over estimate the standard deviation and make capable processes look incapable.)
"Just because we can, doesn't mean we should"
Hers's Why
I once had a customer who requested Cpk numbers with every shipment we sent them. Even though the process was relatively stable, the numbers would change (1.048, 1.039, 1.117 1.250 etc....). In order to avoid his questions as to why the capabilty numbers were getting worse or better (interpreting noise as a signal) I placed them on an XmR and explained to him that these changes were meaningless. For me it was worth it. My experience is that most managers have NO understanding of variation. If the numbers get better they are happy, but if they get worse they want an answer as to why (Not much fun).
To quote Wheeler:
"The purpose of placing capability indexes on an XmR chart is to not monitor the process but to establish the amount of uncertainty that is inherent in the capability indexes themselves. Knowing the extent of this uncertainty will help you to avoid becoming excited about meaningless changes in the value of the capability index. It might even help you to calm down your customer when he thinks your numbers have taken a turn for the worse"
It did for me!
Rich DeRoeck
Tracking Cpk
Rich - I totally agree that if your Customer is requesting monthly or quarterly Cpk numbers an dyou can't have a rational conversation with them to eliminate that requirement then it is certainly in your best interest to track the indices on control charts to attempt to avoid further non-value add churn about 'variation'.
Linda's question was for reporting to her internal management. As quality professionals sometimes our obligation is to provide our maagement what they actually need not what they ask for (well intended but misguided request). It is our obligation to educate on best practices and teh process capability indices are simply not best practice.
Quarterly Capability tracking
Linda - I understand why you want to do this. Management tends to think in quarterly increments as that is frequency of financial updates, taxes, etc. Mangement has a financial obligation to understand process capability and to take appropriate actions to improve processes. Unfortunately, the methods (e.g. rote use of capability indices) by which we try to meet this need are often counterproductive. This occurs because we are a 'Cliff's notes', just give the bottom line type of culture. We want straightforward yes or no answers. We need the answer to the question: are things getting better, worse or staying the same? Additionally management really does need to focus on the actions (or non-action) that are required given the answer to the question regarding capability. It is our job to provide this focus using the appropriate methods.
So the first message is that capabiltiy indexes simply have too many issues to use them in a productive manner. Quarterly comparisons of summary data are also innappropriate (Rip articulated this fairly well). In my experience, the best way is to use a control chart for defect rate data and a multi-vari* (individual values plotted against the specification limits) for continuous data. The subgrouping (X-axis time frame) should be appropriate for the data. I always have the control chart for the continuous data multi-vari to ensure that the assessment of stability is correct, but the spec limimts are what gives us the 'capability' assessment. (Why do I advocate the multi-vari? It is data rich - without data summaries - and is intuitive for the audience to interpret.) Often when I am reporting on multiple metrics I will use the small multiple* approach (many thumbnails of the charts with a table like assessment of the stabiilty and capability. The processes that I want to focus management on are highlighted and their graphs are presented in large format for discussion. (I keep the management team focused on the items they need to take action on or that have just demonstrated a much improved state...) For large metric sets I have started using spark lines* and simple color coding to communicate a large amount of information in a concise format that is not mis-leading at all.
I hope this gives you some useful things to think about
*italics: a simple internet search should turn up a plethora of useful links for information on the italicized methods...
Reasons why you WOULDN'T use Capability for Quarterly reports
Once a process is stable, capability index numbers won't change significantly unless one of two things happens:
1. There is a shift in the process (signalled by the control chart), or
2. someone decides to change the specification limits.
Having said that, the number might change a little...maybe Cpk is originally reported as 1.31, based on 100 observations in a control chart indicating a state of statistical control. Maybe someone takes a snapshot three months later, and Cpk is 1.30. Have things gotten worse? No...
What management needs to know is whether there has been a shift in the process that has adversely affected production. That signal will come from the control chart first, and should be acted upon as soon as the assignable cause signal happens.
Maybe you had chartered a project to improve the performance of the system; had found some dominant but hidden causes and addressed them, or re-engineered some portion of the process. You would expect, then, to see a significant shift in the process, moving the mean closer to the nominal value and reducing variation. That shift in capability might be reported at a quarterly meeting, but with the process stable again after the changes, the Cpk isn't going to change significantly quarter-to-quarter. A management group that wants to look at capability numbers quarterly simply does not understand what those numbers represent. I'd suggest a thorough reading of Don's article for everyone involved...
Sigma X
How to calculate process cabaility ratio if we only have the specification limit and standard deviation of the data
Line Spec = 100 +/- 7
Standard Deviation of 3 mm
"Long term" "short term" origins.
The source of the expressions "Long term" "short term" capability, was Harry and his Six Sigma Scam. He called "short term" "instantaneous" and "long term" was 6 subgroups. His nonsense kept going downhill from there.
Add new comment