{domain:"www.qualitydigest.com",server:"169.47.211.87"} Skip to main content

User account menu
Main navigation
  • Topics
    • Customer Care
    • FDA Compliance
    • Healthcare
    • Innovation
    • Lean
    • Management
    • Metrology
    • Operations
    • Risk Management
    • Six Sigma
    • Standards
    • Statistics
    • Supply Chain
    • Sustainability
    • Training
  • Videos/Webinars
    • All videos
    • Product Demos
    • Webinars
  • Advertise
    • Advertise
    • Submit B2B Press Release
    • Write for us
  • Metrology Hub
  • Training
  • Subscribe
  • Log in
Mobile Menu
  • Home
  • Topics
    • 3D Metrology-CMSC
    • Customer Care
    • FDA Compliance
    • Healthcare
    • Innovation
    • Lean
    • Management
    • Metrology
    • Operations
    • Risk Management
    • Six Sigma
    • Standards
    • Statistics
    • Supply Chain
    • Sustainability
    • Training
  • Login / Subscribe
  • More...
    • All Features
    • All News
    • All Videos
    • Contact
    • Training

The Three-Way Chart

Some data structures need more than an average and range chart

Three-way chart for steel tensile strengths
Donald J. Wheeler
Mon, 03/06/2017 - 12:03
  • Comment
  • RSS

Social Sharing block

  • Print
Body

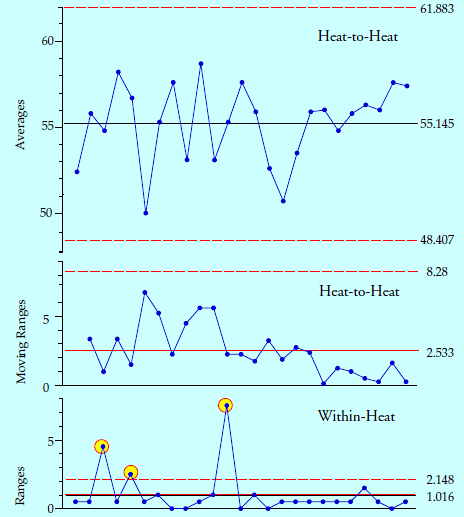
The average and range chart handles most situations where the data can be logically organized into homogeneous subgroups. However, this chart breaks down when faced with a hierarchical data structure containing two or more levels of routine variation. For these situations I developed the three-way chart in 1982.

ADVERTISEMENT

Rational subgrouping

To understand the three-way chart we need to begin with a review of the principles of rational subgrouping. All process behavior charts depend upon rational subgrouping and rational sampling. The reason for this goes back to one of the principles of understanding data: No data have meaning apart from their context. You cannot create meaning by using any mathematical computation. Computations can only distill out the meaning invested in your data by their context. Rational sampling and rational subgrouping are the keys to this distillation. If your computations do not respect the structure created within your data by their context, then your results will be meaningless.

 …

Want to continue?
Log in or create a FREE account.
Enter your username or email address
Enter the password that accompanies your username.
By logging in you agree to receive communication from Quality Digest. Privacy Policy.
Create a FREE account
Forgot My Password

Add new comment

Image CAPTCHA
Enter the characters shown in the image.
Please login to comment.
      

© 2025 Quality Digest. Copyright on content held by Quality Digest or by individual authors. Contact Quality Digest for reprint information.
“Quality Digest" is a trademark owned by Quality Circle Institute Inc.

footer
  • Home
  • Print QD: 1995-2008
  • Print QD: 2008-2009
  • Videos
  • Privacy Policy
  • Write for us
footer second menu
  • Subscribe to Quality Digest
  • About Us
  • Contact Us