Yuliia Kaveshnikova/iStock
The way we think about our process will shape the way we collect, analyze, and interpret our data when things go wrong. This in turn will shape the actions taken and the results obtained. In this column, we look at an example of the difference between the traditional approach and an alternate approach to thinking about your processes.
|
ADVERTISEMENT |
An example
Product 26 is a specialty chemical, produced by one supplier and used by one customer. The production of this chemical involves five different steps. Step 1 is the production of base fluid. The base fluid is shipped by truck to Plant 2 for steps 2, 3, and 4. The resulting intermediate product is then shipped to Plant 3 for Step 5. At the end of Step 5, Product 26 is placed in barrels and shipped to the customer. After each step, properties specific to that step are tested before the material is moved to the next step. Because the three plants are in different states, a batch of Product 26 takes at least three days to produce, and initially they were producing five batches per month.

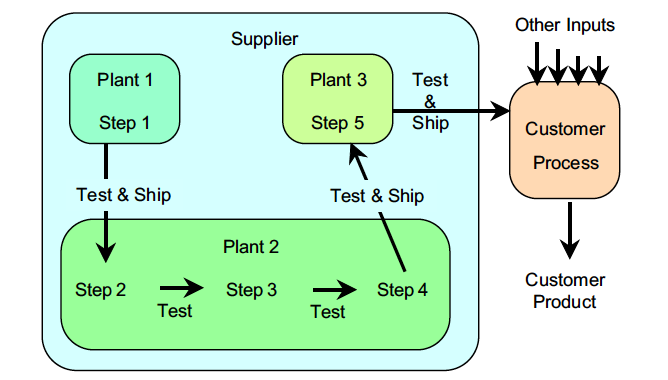
Figure 1: Product 26 production process
For six months after startup, everything was good. Each batch of Product 26 met every specification, and the customer’s process produced good product. But when the customer started using Batch 30, his process failed.
While the customer was shut down, the supplier rushed Batch 31 through the plants. Batch 31 worked in the customer’s plant. Since the customer could turn the problem on by using Batch 30 and then turn it off by switching back to Batch 31, it was fairly clear that Product 26 was the problem.
When Batches 32, 33, and 34 failed in the customer’s plant, the supplier went into panic mode. A troubleshooting team was formed. Since the in-process testing showed conformity throughout the process, the troubleshooting team began at Step 5.
Calibrations were checked; values for the process inputs were verified; and process trials were run. Some of these process trials evaluated different combinations of process settings, while others considered whether additional process variables needed to be controlled.
While the above was going on, they continued to produce Product 26. Batches 35, 36, and 37 all worked in the customer’s plant. Then:
Batch 38 failed.
Batches 39, 40, and 41 worked.
... Batch 45 worked.
... Batch 47 worked.
... Batch 51 worked.
While all 51 of the batches to this point had met all of the specifications, only 10 of the last 22 batches had run in the customer’s plant!
Then Batch 52 failed its test at the end of Step 1. The supplier quarantined this material and started running Batch 53.
Meanwhile the troubleshooting team had found nothing at Step 5, so they went to Plant 2, in a different state, to begin working on Step 4.
... Batch 55 worked.
Finding nothing to fix on Step 4, the troubleshooting team moved back to Step 3.
... Batch 63 worked.
... Batch 65 worked.
Finding nothing to fix on Step 3, the troubleshooting team moved back to Step 2.
... Batch 71 worked.
... Batches 80, 82, 83, and 85 worked.
At this point, five months had passed since the first failure. And in the last three months, only eight of 33 batches had worked for the customer.
Now the troubleshooting team moved to Plant 1 (in yet another state). One of the specifications for Step 1 was that the base fluid should not contain more than 1,500 ppm of Compound M. This specification was a requirement for safe handling—if the base fluid had more than 1,500 ppm of Compound M, there would be a dangerous buildup of hydrogen gas in the barrels shipped to the customer. The conformance to specifications mindset can be seen in the histogram in Figure 2. Even though this histogram has two mounds, except for Batch 52, they never came close to the specification for Compound M.

Figure 2: Histogram for Compound M, batches 1–85
The conformance to specifications mindset, like the histogram above, ignores the time-order sequence of the data. But when things go wrong it’s the time-order sequence that will contain the essential information. And the only way to discover this time-order information is to use a running record or a process behavior chart. Figure 3 shows the running record for Compound M. The red dots indicate those batches that failed in the customer’s plant.

Figure 3: Levels of Compound M
Product 26 will not work in the customer’s plant when Compound M exceeds 200 ppm!
After Batch 52 had 2,650 ppm of Compound M, they reworked this failed material by feeding small amounts back into the distillation column as they processed subsequent batches. This is why the batches following Batch 52 have elevated levels of Compound M, and it’s why only eight of the last 33 batches worked in the customer’s plant. The elevated levels of Compound M were poisoning the customer’s process.
The customer had not placed a specification on Compound M because they didn’t know how it affected their process. This important input to their process had been overlooked. And everybody suffered the consequences.
The supplier was unaware of the changes in the level of Compound M because they were only looking to see whether the product would be safe to handle. As long as they were checking for conformance to the specification, there was no problem with Compound M or Step 1 except for Batch 52. As soon as they drew the running record in Figure 3, they knew they had found the source of the customer’s problem.
Figure 4 shows the X chart for Compound M with limits based on the first 25 batches. Regardless of whether the baseline contains anywhere between 15 and 30 batches, the story remains the same. Batch 30 is different from the first 29 batches. Had they been plotting their data on a process behavior chart, when Batch 30 failed they could have gone back and discovered how Batch 30 differed from the earlier batches. This probable cause of failure would have been confirmed beyond all doubt by Batch 34, and everyone could have been spared five months of grief, anguish, and recriminations.

Figure 4: X Chart for Compound M
Two definitions of trouble
A failure to conform to specifications is one definition of trouble. Everyone understands this. But a process can also be in trouble when it’s not being operated consistently. It’s this second definition of trouble that’s addressed by a process behavior chart. When things go wrong, the key question is, “Where and when has a change occurred?” And process behavior charts enable you to answer this question.
Specifications are for sorting product at the end of the line. Process behavior charts are for pinpointing when and where the process has changed. Using specifications alone resulted in monumental trouble here because no one noticed when the process changed.
Summary
Seeking to reduce variation by working with the controlled process inputs is a low payback strategy. Variation comes from the uncontrolled process inputs. In the example above, they spent five months looking for trouble in all the wrong places because they weren’t tracking their process behaviors.
The large number of uncontrolled variables makes looking for specific variables to use to fix your process exceedingly difficult. However, by tracking the process behavior, rather than looking for variables to fix, you can find the dominant uncontrolled inputs.
A process may be operated inconsistently while the outcomes stay within the specifications. Inconsistent operation will be due to some dominant but uncontrolled process input. And the only way to find these assignable causes of exceptional variation is to use a process behavior chart.
Those who use process behavior charts will always have an advantage over those who do not use them.
Donald J. Wheeler’s complete “Understanding SPC” seminar may be streamed for free; for details, see spcpress.com.

Add new comment