{domain:"www.qualitydigest.com",server:"169.47.211.87"} Skip to main content

User account menu
Main navigation
  • Topics
    • Customer Care
    • FDA Compliance
    • Healthcare
    • Innovation
    • Lean
    • Management
    • Metrology
    • Operations
    • Risk Management
    • Six Sigma
    • Standards
    • Statistics
    • Supply Chain
    • Sustainability
    • Training
  • Videos/Webinars
    • All videos
    • Product Demos
    • Webinars
  • Advertise
    • Advertise
    • Submit B2B Press Release
    • Write for us
  • Metrology Hub
  • Training
  • Subscribe
  • Log in
Mobile Menu
  • Home
  • Topics
    • 3D Metrology-CMSC
    • Customer Care
    • FDA Compliance
    • Healthcare
    • Innovation
    • Lean
    • Management
    • Metrology
    • Operations
    • Risk Management
    • Six Sigma
    • Standards
    • Statistics
    • Supply Chain
    • Sustainability
    • Training
  • Login / Subscribe
  • More...
    • All Features
    • All News
    • All Videos
    • Contact
    • Training

Attribute Gauge Uncertainty, Part 1

How to determine the accuracy and capability of gauges such as go/no-go

Jody Muelaner
Mon, 09/30/2019 - 12:02
  • Comment
  • RSS

Social Sharing block

  • Print
  • Add new comment
Body

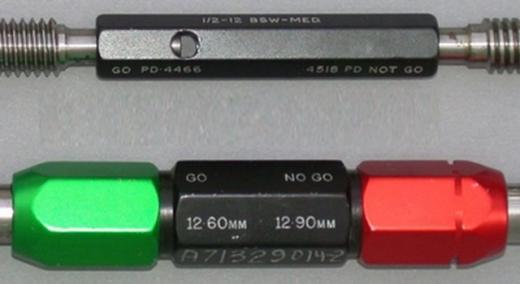
I’ve written a lot about how to evaluate the uncertainty measurements. My articles have ranged from basic introductions to metrology and uncertainty budgets, to more advanced topics such as sensitivity coefficients and Monte Carlo simulation. To date, all of the examples I’ve used have been for variable gauges. These are measurement instruments that give a numerical measurement result, on a scale, dial or digital display.

 …

Want to continue?
Log in or create a FREE account.
Enter your username or email address
Enter the password that accompanies your username.
By logging in you agree to receive communication from Quality Digest. Privacy Policy.
Create a FREE account
Forgot My Password

Comments

Submitted by William A. Levinson on Mon, 09/30/2019 - 13:43

Best explanation I have seen yet

This is the best explanation I have seen so far of attribute gage R&R. It shows that, even though the attribute gage returns only pass/fail data, if one measures the same part (or known standard) enough times, it is possible to get a percentage of items that pass in each case, and use the normal distribution to estimate the gage's mean and also its standard deviation.

  • Reply

Add new comment

Image CAPTCHA
Enter the characters shown in the image.
Please login to comment.
      

© 2025 Quality Digest. Copyright on content held by Quality Digest or by individual authors. Contact Quality Digest for reprint information.
“Quality Digest" is a trademark owned by Quality Circle Institute Inc.

footer
  • Home
  • Print QD: 1995-2008
  • Print QD: 2008-2009
  • Videos
  • Privacy Policy
  • Write for us
footer second menu
  • Subscribe to Quality Digest
  • About Us
  • Contact Us