{domain:"www.qualitydigest.com",server:"169.47.211.87"} Skip to main content

User account menu
Main navigation
  • Topics
    • Customer Care
    • FDA Compliance
    • Healthcare
    • Innovation
    • Lean
    • Management
    • Metrology
    • Operations
    • Risk Management
    • Six Sigma
    • Standards
    • Statistics
    • Supply Chain
    • Sustainability
    • Training
  • Videos/Webinars
    • All videos
    • Product Demos
    • Webinars
  • Advertise
    • Advertise
    • Submit B2B Press Release
    • Write for us
  • Metrology Hub
  • Training
  • Subscribe
  • Log in
Mobile Menu
  • Home
  • Topics
    • 3D Metrology-CMSC
    • Customer Care
    • FDA Compliance
    • Healthcare
    • Innovation
    • Lean
    • Management
    • Metrology
    • Operations
    • Risk Management
    • Six Sigma
    • Standards
    • Statistics
    • Supply Chain
    • Sustainability
    • Training
  • Login / Subscribe
  • More...
    • All Features
    • All News
    • All Videos
    • Contact
    • Training

The Data-Free Graph

How to streamline your analysis

Donald J. Wheeler
Tue, 04/01/2014 - 13:59
  • Comment
  • RSS

Social Sharing block

  • Print
  • Add new comment
Body

Why bother to plot your data? A simple shortcut is available that will allow you to do your analysis without the data getting in the way. How do you accomplish this breakthrough? Read on.

ADVERTISEMENT

This marvelous advance in analysis is known as the “data-free graph.” As usual we begin with a collection of data as in figure 1.


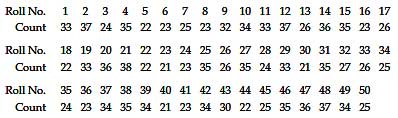
Figure 1: Number of blemishes per roll

Now this is way too much detail. We cannot readily absorb this much information, so we simply extract a few summary statistics from our data. First on this list might be the average or a median. A median value for the number of blemishes per roll is 28.5.

Next we need to characterize how the data are spread out above and below the median, so we find the minimum and maximum values for the data. For the number of blemishes per roll these values are 21 and 38 respectively. To further refine our summary of how the data spread out we also find the quartiles for the data. The quartiles for the number of blemishes per roll are 23 and 35.

 …

Want to continue?
Log in or create a FREE account.
Enter your username or email address
Enter the password that accompanies your username.
By logging in you agree to receive communication from Quality Digest. Privacy Policy.
Create a FREE account
Forgot My Password

Comments

Submitted by William A. Levinson on Tue, 04/01/2014 - 10:26

Figure 8 shows excellently

Figure 8 shows excellently why it is important to look at the histogram as well as the box and whisker plot.
  • Reply

Submitted by beth.propst on Tue, 04/01/2014 - 10:57

In reply to Figure 8 shows excellently by William A. Levinson

Data Free?

You sly fox, you. You had me fooled. As I'm reading the article with great eagerness, as i always do your pieces, I'm thinking to myself "What are these words coming out of Don Wheeler's mouth? Has he had a nervous breakdown or what?" Silly me to forget what day it was. Great satire, Don, and I was your April Fool. (Oh well, I've been a fool before and I daresay i will be again.)

  • Reply

Submitted by Donald J. Wheeler on Tue, 04/01/2014 - 15:58

In reply to Figure 8 shows excellently by William A. Levinson

For Bill

How does Figure 8 give any encouragement to the use of a data-free graph?
  • Reply

Submitted by Bill Sproat on Tue, 04/01/2014 - 11:12

Distribution Transform

Dr. Wheeler,

I'm disappointed that you failed to properly transform the data to the correct distribution in each case.  This would have solved the histogram problem without having to dig into the process that produced the data.  Do you really expect me to leave my desk and talk to those production people?  My software applies the transformation so easily - it even suggests which distribution to use!  I'll leave the messy details to the production folks.

Happy April Fools.  - Great article.

  • Reply

Submitted by rderoeck on Tue, 04/01/2014 - 11:22

Not me

You didn't fool me. I have too many of your books on my shelf!!

  • Reply

Add new comment

Image CAPTCHA
Enter the characters shown in the image.
Please login to comment.
      

© 2025 Quality Digest. Copyright on content held by Quality Digest or by individual authors. Contact Quality Digest for reprint information.
“Quality Digest" is a trademark owned by Quality Circle Institute Inc.

footer
  • Home
  • Print QD: 1995-2008
  • Print QD: 2008-2009
  • Videos
  • Privacy Policy
  • Write for us
footer second menu
  • Subscribe to Quality Digest
  • About Us
  • Contact Us