{domain:"www.qualitydigest.com",server:"169.47.211.87"} Skip to main content

User account menu
Main navigation
  • Topics
    • Customer Care
    • FDA Compliance
    • Healthcare
    • Innovation
    • Lean
    • Management
    • Metrology
    • Operations
    • Risk Management
    • Six Sigma
    • Standards
    • Statistics
    • Supply Chain
    • Sustainability
    • Training
  • Videos/Webinars
    • All videos
    • Product Demos
    • Webinars
  • Advertise
    • Advertise
    • Submit B2B Press Release
    • Write for us
  • Metrology Hub
  • Training
  • Subscribe
  • Log in
Mobile Menu
  • Home
  • Topics
    • 3D Metrology-CMSC
    • Customer Care
    • FDA Compliance
    • Healthcare
    • Innovation
    • Lean
    • Management
    • Metrology
    • Operations
    • Risk Management
    • Six Sigma
    • Standards
    • Statistics
    • Supply Chain
    • Sustainability
    • Training
  • Login / Subscribe
  • More...
    • All Features
    • All News
    • All Videos
    • Contact
    • Training

What Is Measurement Risk?

How to understand it and lower it

Understanding measurement risk can mean the difference between a successful mission or a failed one
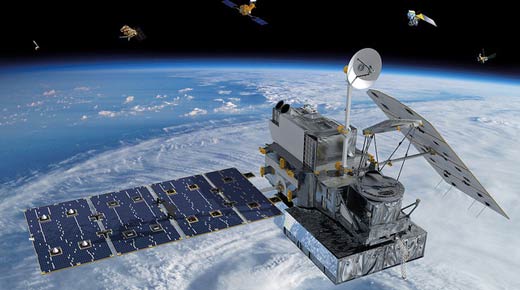
Credit: NASA Goddard Space Flight Center

Henry Zumbrun
Wed, 04/05/2017 - 12:03
  • Comment
  • RSS

Social Sharing block

  • Print
  • Add new comment
Body

Imagine that a satellite is launched into space and communications are intermittent. This happens because the satellite is wobbling, which causes connection problems in the receiver. The cause of the wobbling is identified: It is the result of not using a calibration provider with a low enough uncertainty.

ADVERTISEMENT

The load cells used to measure the amount of fuel stored in the satellite must be almost perfect. However, if a calibration provider doesn’t have the right measurement capability, the load cells won’t be accurate enough to make the measurement. In this case, the result is a wobbling satellite and significant resources needed to fix the problem.

 …

Want to continue?
Log in or create a FREE account.
Enter your username or email address
Enter the password that accompanies your username.
By logging in you agree to receive communication from Quality Digest. Privacy Policy.
Create a FREE account
Forgot My Password

Comments

Submitted by Stanley Alekman on Wed, 04/05/2017 - 10:39

The graphs suggest a commercial program for the calculations.

Is there a commercial program to automate the calculations and present the graphics you depict in the article?

  • Reply

Submitted by ccwerner55 on Wed, 04/05/2017 - 14:01

In reply to The graphs suggest a commercial program for the calculations. by Stanley Alekman

Commercial software

Stanley

Take a look at Minitab. It should be useful for this type of data gathering and presentation.

  • Reply

Add new comment

Image CAPTCHA
Enter the characters shown in the image.
Please login to comment.
      

© 2025 Quality Digest. Copyright on content held by Quality Digest or by individual authors. Contact Quality Digest for reprint information.
“Quality Digest" is a trademark owned by Quality Circle Institute Inc.

footer
  • Home
  • Print QD: 1995-2008
  • Print QD: 2008-2009
  • Videos
  • Privacy Policy
  • Write for us
footer second menu
  • Subscribe to Quality Digest
  • About Us
  • Contact Us