
Social Sharing block
In order to best illustrate how enterprisewide SPC software can help address shop-floor problems and then funnel the captured data to the corporate level where strategic issues can be analyzed, here is a case study of a hypothetical manufacturing facility. In it, the company makes effective use of SPC for data-driven decisions.
A global food products manufacturing company with 11 sites worldwide had chosen to master quality, both tactically and strategically, as its top goal. Each site collected and analysed data in the company’s enterprisewide SPC software, both to monitor and respond to quality issues at the site, and to share those same data with the corporate office.
At the company’s Prague site, the quality manager looked at her shop-floor data for the previous month. As figure 1 indicates, the software reported a total of 737 events, which at first glance seemed like a big deal to the manager. However, on closer inspection, she could see that these weren’t massive quality issues with the product or processes. However, there were 517 missed data checks. Although not a line-stopping issue, missed checks could result in noncompliance to agreements with customers or industry requirements.
 Figure 1: Prague site monthly data
The manager wanted to follow up on this with the line supervisors but needed more information.
As figure 2 below shows, the manager used the SPC software to drill down into the 517 missed checks. Here she could see that line two had the lion’s share of the issues with 242 missed checks. Now she knew which supervisor to talk with to address the problem.
Figure 2: Event summaries by line
Meanwhile at corporate headquarters, the quality director had access to the same dashboard, as shown in figure 3, but with the additional data from all 11 facilities. It’s interesting to note that while the manager of the Prague site was busy addressing an issue that was clearly important to her, it barely registered as an important issue from a corporate viewpoint. As the dashboard indicates, the London site clearly is having the most issues, with Prague only number nine on the list. But clearly there’s room for improvement companywide.
So many sites, so much digging and detective work, especially at the corporate level, to determine which issues to prioritize. The quality director stared at the screen and sighed, thinking, do I really have to drill down into each of those 11 sites and try to divine where my critical problems are? How tedious! There must be a better way.
Figure 3: Site data at the corporate level showing limit violations for all sites
Is all this granular information—excellent for site tactics—as useful for the corporate view? Especially when it means working with data from 11 different sites? It’s obvious that tactical and strategic data are interdependent, but by no means the same. To discover how these same data are mastered at the corporate level, read on.
Analyzing data at the strategic level
We just saw how the quality manager at one site used SPC software to examine a summary of missed data checks and determine which line was having the most trouble. At corporate headquarters, that same software is displaying a different data set, one that was more in keeping with big-picture quality analysis, as seen in figure 3 above. It shows manufacturing limit violations for the measurements corporate has defined as critical to quality for all sites, such as net weight, slice thickness, and so forth. A Pareto chart indicates how the sites compare with one another in terms of violations.
While this is useful to get a “feel” for how the company is doing, it really isn’t ideal for determining where the specific problem areas are. This volume of granular data aren’t as useful for corporate quality professionals. It’s an example of “doing” quality at the strategic company level by applying the same types of analysis that work at the site level. This isn’t “bad” or “wrong,” but it’s not as effective as it could be. These data would be useful, however, when the corporate quality professional was ready to talk with the site quality manager.
We left our corporate quality director frowning at the chart and wishing there was a better way to compare the sites and access more details without having to dig into each and every site. The Pareto chart, which doesn’t give specific yield numbers, really is the wrong tool for the job. However, the company’s SPC software did offer another dashboard that the quality director hadn’t used up to that point. He gave it a try, and the summary seen in figure 4 appeared on his screen.
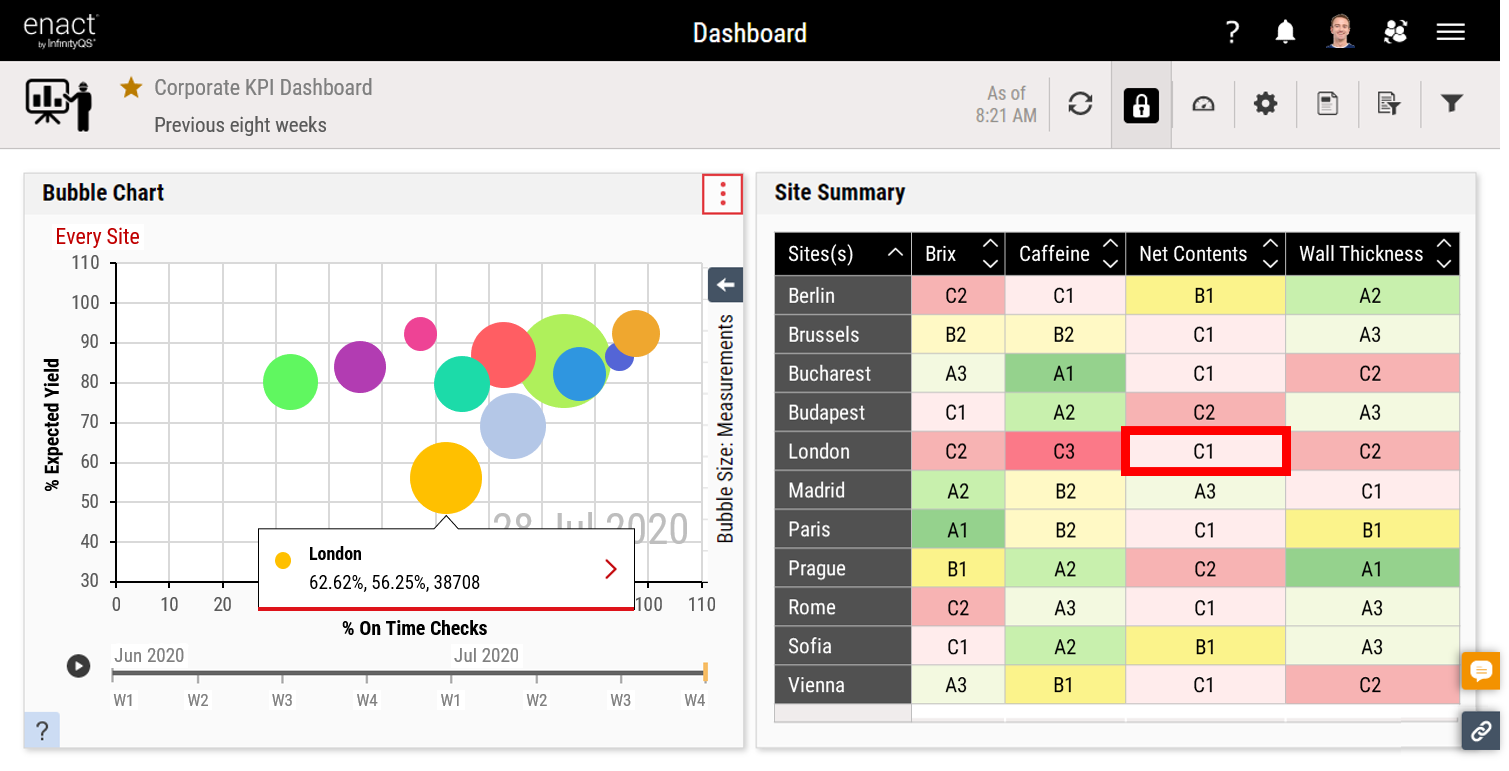
Figure 4: Key performance indicators for all sites
This is more like it, he thought. This simple bubble chart presented a wealth of information at a glance. Each bubble represented a site, with the left axis indicating percent expected yield, the bottom axis indicating percent on-time checks, and the size of the bubble showing the relative number of measurements. Very quickly not only could he see that London had the lowest yield of all 11 sites—a troubling 56.25 percent—he could also look at specific details by clicking on one of the graded cells in the table on the right. Knowing that net contents was an important metric that could affect company financials—and by extension profit strategy—he drilled into the C1 cell in the net contents column for the relevant figures about yield at the London site. A table like the one in figure 5 came up.
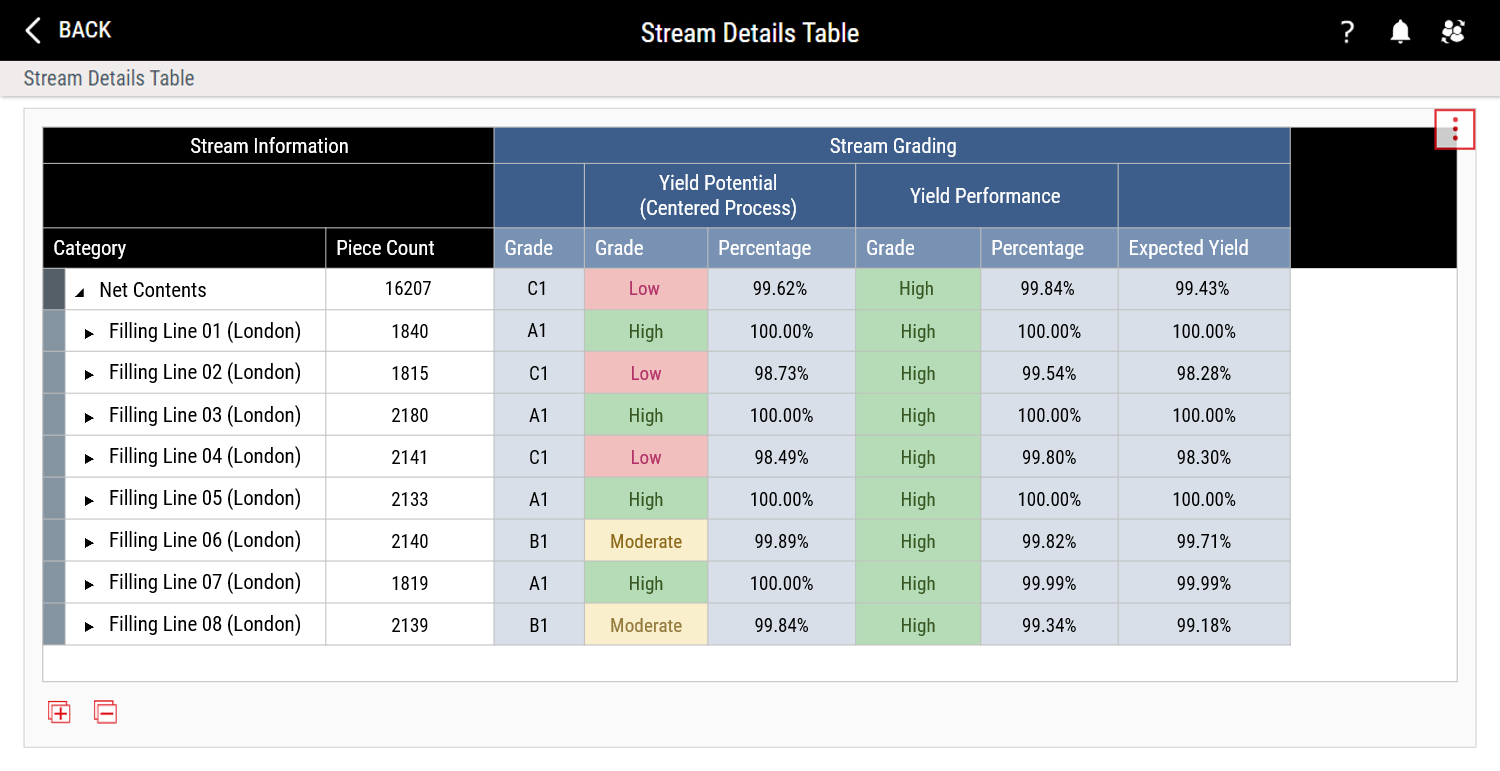
Figure 5: Details for filling lines at the London site
This table shows that the worst offenders at the London site are lines 2 and 4, followed by lines 8 and 6, which are close to 100-percent yield but still off. Of course, there’s more the quality director could drill into to discover how each product was performing on those lines (maybe they were having setup issues?), but the information here would get the conversation started with the quality manager at the London site.
Turning insights into profitable improvements
Compare the efficient use of the bubble chart to immediately identify London as a problem site, in terms of yield (a key metric), as opposed to drilling down into each site individually to identify the culprit. Data that can support strategic initiatives should be a critical component of any enterprisewide SPC system, especially a cloud-based one. Such data make a world of difference when leveraging existing assets to actualize strategic goals.
This is the kind of insight most executive-level managers think might be possible, but they tend to assume it’s not really possible for them. However, it is. Unlike the shop-floor actions described in the previous article, where the software tells an operator when to take action based on statistical rules and workflows, these corporate-level data indicate, often subtly, where to marshal resources, start improvement projects, and otherwise further company-wide goals.
Yes, these kinds of results are possible. The first step is for the appropriate persons in your organization to think about data at a strategic scale. This article described a hypothetical situation, but it’s based on results that organizations have achieved. They already had the data; they just needed to look at them in the right way and apply the knowledge. As a result, they’ve saved hundreds of thousands of dollars every year based on the insights they’ve gotten.
The right software in the right hands makes these transformations more possible than you’d think. It isn’t an academic statistics exercise; it’s an opportunity to roll up your sleeves and, with a few mouse clicks and keyboard strokes, bring some real results to your company.
Add new comment