Social Sharing block
It would appear that there is still considerable confusion regarding which method to use in evaluating a measurement process. There are many voices speaking on this subject, however, most of them fail to use the guidance provided by statistical theory, and as a result, they end up in a train wreck of confusion and uncertainty. Here the three most common methods will be compared side by side.
Our example will use the data obtained from a gauge used to measure gasket thicknesses in mils. Three operators measure five parts two times each to obtain 30 measurements arranged into 15 subgroups of size 2 as shown in figure 1. To understand these data it is helpful to observe that the operator-to-operator differences show up between the subgroups, the part-to-part differences show up between the subgroups, and the test-retest error shows up within the subgroups. This organization is the key to interpreting these data.
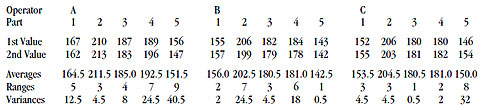
Figure 1: The gasket thickness data. Click here for larger image.
…
Comments
d*2
Thank You
Thought I was losing my mind, seeing phantom bias correction coefficients used by Wheeler that don't match up with the standard charts.
Measurement method acceptability via ANOVA method
In regards to the ANOVA approach, I have only been made aware of using %contribution and its limits (<1% acceptable, 1% to 9% probably acceptable and >9% unacceptable) to determine measurement acceptability. In this article, Dr Wheeler mentioned Estimated ICC as the predominant criteria determining measurement acceptability using the ANOVA method. Even if %contribution is 10%, ICC would be 0.9 which is still a very good correlation, wouldn't it? Did I miss something?
Flags in the sample parts for GRR
In my study of a GRR, the range of parts you choose for the 10 samples greatly affects the NDC or %GRR. My opinion previously is that I want my gage to be able to determine the difference between good and no good parts, so I have chosen parts to range from out of tolerance low to out of tolerance high. Recently I have seen posts that my sampling should be random according to the current process, but I don't think this tests the gage's ability to determine the difference between good/no good.
What is your opinion of manufacturing the study to include out of tolerance parts?
Thank you,
Ken
(I have posted this on several other threads. I know it is not good form, but please do not delete my account.)
Add new comment