Tue, 06/04/2013 - 00:00
Social Sharing block
Body
All data are historical. All analyses of data are historical. Yet all of the interesting questions about our data have to do with using the past to predict the future. In this article I shall look at the way this is commonly done and examine the assumptions behind this approach.
|
ADVERTISEMENT |
A few years ago a correspondent sent me the data for the number of major North Atlantic hurricanes for a 65-year period. (Major hurricanes are those that make it up to category 3 or larger.) I have updated this data set to include the number of major hurricanes through 2012. The counts of these major hurricanes are shown in a histogram in figure 1.
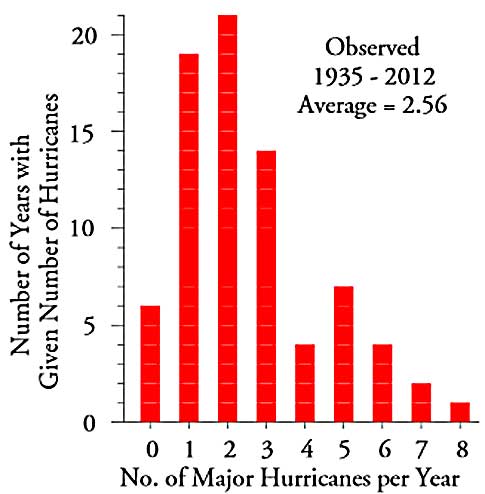
Figure 1: Histogram for the number of major North Atlantic hurricanes 1935–2012
…
Want to continue?
Log in or create a FREE account.
By logging in you agree to receive communication from Quality Digest.
Privacy Policy.
Comments
Excellent Article
An excellent, practical article. And once again, the run chart comes through. Thank you.
So Important!
This is a great example of a vitally important concept that is, unfortunately, left out of most statistical training (and much of statistics education) these days. Entirely too many people are willing to jump into a data set, start taking random samples, testing for normality, and all kinds of other harmful nonsense prior to checking for homogeneity. I remember Deming discussing a similar concept, and his words apply here, I think:
"This all simple...stupidly simple...who could consider himself in possession of a liberal education and not know these things? Yes...simple...stupidly simple...but RARE! UNKNOWN!" (From the Deming Library vol VII, The Funnel Experiment).
This article should be required reading in every statistics class.
Homogeneous Data
Great article on a issue not commonly discussed. Too often homogeneity of data is assumed but never verified. From my college stats class (many years ago) I still recall an example of a lack of homogeneity that had startling consequences. The draft lottery in 1969. The days of year were numbered and placed on ping pong balls (1 for Jan 1st... 366 for Dec 31st). The numbers were transported to the mixer in twelve shoe boxes, one for each month. The balls for Jan were pored into the mixer first, followed by Feb, Mar, etc thru Dec. The mixer was turned and a ball was removed and the number recorded. They did this until the last ball was removed. The data is on Wikipedia at: http://en.wikisource.org/wiki/User:Itai/1969_U.S._Draft_Lottery_results. Though the process was random, the results were not due to the non-homogeneity of the position of the balls in the mixer and the assumption that turning the mixer would ensure homogeneity. The results: if your birthday was in Dec, you had a 83% chance (26/31) of being drafted. If your birthday was in Jan, you had a 45% (16/31) chance.
Excellent ! What a great
Excellent ! What a great example. However I have no doubt that the masses of Six Sigma and Lean Sigma true believers and blind followers of Montgomery just won't get it.
Don't Get It
It's continues to puzzle me why data analyists/quality engineers don't start with plotting the data in time order. You would think this would be the first logical step. So very easy to do and so much to be gained. It appears advances in statistical software has made it so easy to do dumb things.
Rich D.
It's what they've learned, I think
Rich, I think it's what they've learned. Statistical thinking takes a lot of effort to learn, and then some effort to do even on a regular basis. People taking most statistics courses see a time-order plot as just one of many graphical tools available, and usually only when they briefly cover some graphing options. Most of the rest of the class is devoted to histograms, tests of hypotheses, and other tools. They only learn to do enumerative studies.
Tony's on to something, as well. It doesn't help when most of the Six Sigma literature treats SPC as an afterthought, when noted SPC authors publish papers and books spuriously identifying non-existent "inherent flaws in XbarR charts" and the Primers used as references for Black Belt certification exam preparation classes state outright that you can tell if a process is in control by looking at a histogram. I just spent almost three weeks going back and forth with a "Master Black Belt" in another forum who told some young engineer not to bother with time order in a set of data that he had, just take a random sample, because "a random sample is representative, by definition."
Histograms?
Historgrams? ha. Those are bar graphs. And you people call yourselves "quality".
Histograms
Add new comment