{domain:"www.qualitydigest.com",server:"169.47.211.87"} Skip to main content

User account menu
Main navigation
  • Topics
    • Customer Care
    • FDA Compliance
    • Healthcare
    • Innovation
    • Lean
    • Management
    • Metrology
    • Operations
    • Risk Management
    • Six Sigma
    • Standards
    • Statistics
    • Supply Chain
    • Sustainability
    • Training
  • Videos/Webinars
    • All videos
    • Product Demos
    • Webinars
  • Advertise
    • Advertise
    • Submit B2B Press Release
    • Write for us
  • Metrology Hub
  • Training
  • Subscribe
  • Log in
Mobile Menu
  • Home
  • Topics
    • 3D Metrology-CMSC
    • Customer Care
    • FDA Compliance
    • Healthcare
    • Innovation
    • Lean
    • Management
    • Metrology
    • Operations
    • Risk Management
    • Six Sigma
    • Standards
    • Statistics
    • Supply Chain
    • Sustainability
    • Training
  • Login / Subscribe
  • More...
    • All Features
    • All News
    • All Videos
    • Contact
    • Training

100% Inspection and Measurement Error

How to handle the problem of misclassified product

Donald J. Wheeler
Tue, 05/03/2011 - 09:50
  • Comment
  • RSS

Social Sharing block

  • Print
  • Add new comment
Body

One-hundred-percent inspection is commonly used to avoid shipping nonconforming product. Each of the items produced is measured and judged to be either conforming or nonconforming. The conforming items get shipped, and the nonconforming items get set aside for use as factory-authorized replacement parts or some other equally ignominious fate. It all seems quite simple until you do the math. The purpose of this article is to show what happens when a product stream is subjected to 100-percent screening inspection with less-than-perfect measurement systems.

To simplify the mathematics, I will assume that the production process is being operated predictably, and that the stream of product values can be represented by our generic, worst-case probability model, the normal distribution. In our model we shall denote these product values by Y. In figure 1 we see the distribution of product values and the specifications for this product characteristic. This distribution represents the product stream, and when we measure an item, it is the value for Y that we are trying to determine.


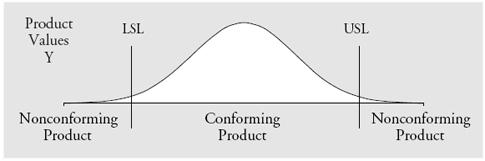
Figure 1: The distribution of the product values Y

 …

Want to continue?
Log in or create a FREE account.
Enter your username or email address
Enter the password that accompanies your username.
By logging in you agree to receive communication from Quality Digest. Privacy Policy.
Create a FREE account
Forgot My Password

Comments

Submitted by William A. Levinson on Tue, 05/03/2011 - 16:10

Dealing with measurement uncertainty

This article addresses the real-world aspect of imperfect measurement systems instead of assuming the sterile textbook assumption that the measurement displayed by the gage is the actual dimension of the part. It's an important connection between gage R&R studies and the use of gages to ensure outgoing quality. I worked in an organization that called the practice of testing to artificially tightened specifications guardbanding; it protected the customer from borderline nonconforming product at the cost of rejecting borderline acceptable product.

  • Reply

Add new comment

Image CAPTCHA
Enter the characters shown in the image.
Please login to comment.
      

© 2025 Quality Digest. Copyright on content held by Quality Digest or by individual authors. Contact Quality Digest for reprint information.
“Quality Digest" is a trademark owned by Quality Circle Institute Inc.

footer
  • Home
  • Print QD: 1995-2008
  • Print QD: 2008-2009
  • Videos
  • Privacy Policy
  • Write for us
footer second menu
  • Subscribe to Quality Digest
  • About Us
  • Contact Us