
Social Sharing block
Most data in business and industry belong to the category known as observational data. These data are the voice of your processes because they are the result of ordinary operations rather than an experiment.
|
ADVERTISEMENT |
Because the purpose of analysis is insight, the question is how to analyze observational data to gain insight into your processes. Here, we’ll illustrate three approaches to answering this question. Everyone who uses observational data needs to understand the differences between these approaches.
Description
The first approach is description. This uses the descriptive statistics and histograms taught in introductory classes in statistics. For our example, we’ll use the 200 observations listed in Figure 1.
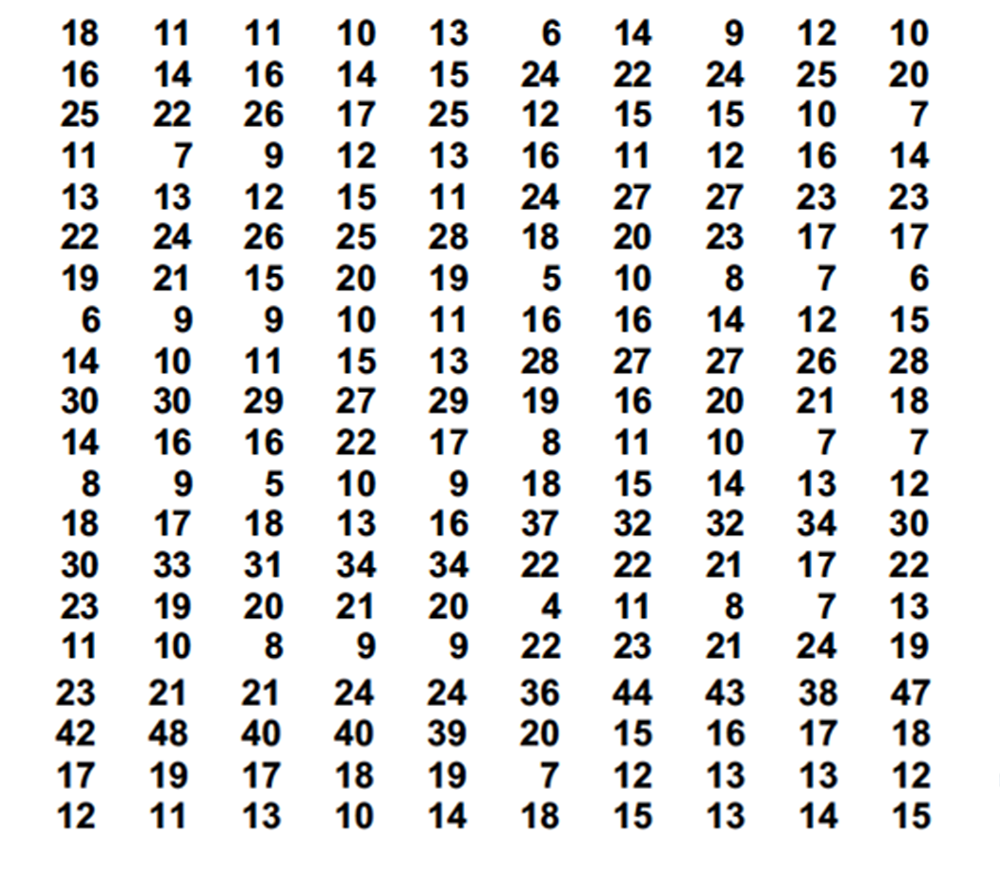
Figure 1: 200 original observations X
…
Comments
Taking action
Once again we see the value of finding the signals (of process changes) within our data. In some ways finding the signals is the easy part … because if we collect data as a basis for action there is still more to do. Is there the means and motivation to do something to address these signals? If yes, and if successful in doing so, process improvement is inevitable, helping to lower costs and improve quality. If not, perhaps the only one smiling is your competitor.
Exact definition of data homogeneity
I am asking myself "What is the exact definition of “data homogeneity”? Is the homogeneity data judged with respect to a given model? For example, since the data in Figure 3 fit satisfactorily the log-normal model, can it be judged homogeneous with respect to this specific model? Is it surprising that the same data are not homogeneous with respect to a normal model, given the fact that the data are clearly non-normal? Process behavior charts are known to fit best normal data. I wish the data were plotted also on an XmR chart. I wish Tolerance Intervals (TI) were also calculated (both normal TI and non-normal TI despite the fact that only 200 data are given) since they refer to individual data.
Normality Myth
Control charts work for ANY data. The normality myth is perpetrated by Sick Sigma con men wanting you to buy outrageously priced statistical software that you don't need.
https://www.qualitydigest.com/inside/statistics-column/normality-myth-090819.html
Use this FREE XmR charter:
https://QSkills3D.com/resources/MQCC.html
Reply for RB The second…
Reply for RB
The second axiom of data analysis is that probability models do not generate your data. The fourth axiom of data analysis is that no histogram can be said to follow a particular probability model (to the exclusion of all others). Therefore, agreement between a histogram and a probability model tells us nothing about the internal consistency of the data. The only operational definition of homogeneity is a process behavior chart. When a process is operated unpredictably the data will not be homogeneous. When the data are homogeneous the process will have been operated predictably. Data homogeneity and process predictability are two sides of the same coin.
What is a Homogeneous Process?
*yep, most people mis-spell it including me…
First it has nothing to do with any distribution. Read the dictionary definition of homogeneity: a uniform, consistent, or similar composition/character throughout, It is used to describe things of the same kind, such as a "homogeneous mixture" in chemistry. Synonyms include uniform, alike, consistent, and identical.
Mathematically and Physics based: A homogenous process is a seemingly random process where the factor that controls the average also controls the standard deviation. In the simplest terms this means the largest component of variation is piece to piece and within piece, lot to lot, operator to operator, equipment to equipment, measurement error and time to time are trivially minor. The SD of the between subgroup variation is: SD_Xbar = SD_Total/sqrt[n] where n = the subgroup sample size and SD_Total is estimated by the (pooled or average) within subgroup variation.
If you have a homogenous process then the within subgroup variation is a perfectly good estimator of the total variation. The between subgroup variation is very small. This also known as sampling error or tragically ‘noise’. The within subgroup and between subgroup variation are predictable without patterns within calculated limits.
A non homogenous process is one where the SD is controlled by one factor and another factor controls the between subgroup variation. In a non-homogenous process the total SD is a function of both the within subgroup variation and the between subgroup variation. Piece to piece variation is not the controlling component for variation. Now the other components play in a major way. Now the SD_Total is the sqrt(SD_Within^2 +SD_Between^2)
In a stable process, the process stream will appear homogenous. When an “Assignable Cause” occurs the process becomes non-homogenous, or “out-of control”.
Another Good Article
When I teach people about "sigma" levels, I always urge them to view a process behavior chart of the data. Special cause can distort data and create a "distribution" that isn't a real description of the process. This is a terrific example.
Sigma Levels
"Sigma levels" are a myth perpetrated by sellers of the Six Sigma Scam. You should NEVER use them.
The "6 sigma level" was concocted by a Harry, a school teacher, turned self-confessed con man. He based the trash on the height of a stack of discs!
Birth of a Fraud:
https://QSkills3D.com/resources/birth.html
Add new comment