
Social Sharing block
The Individuals chart is the “Swiss Army knife” of control charts. It usually approximates the supposedly “correct” chart under most conditions, and its use is much easier to understand and explain. It can also save you a major side trip into the swamp of unnecessary calculation minutiae, especially avoiding square roots!
|
ADVERTISEMENT |
Based on real data
Suppose a quality analyst (QA) comes to you saying, “We’re trying to reduce this particular infection, and I had some data: the number of infections and patient days for the past 30 individual months. My software led me down its decision tree and told me to do a u-chart, which you can see in figure 1:
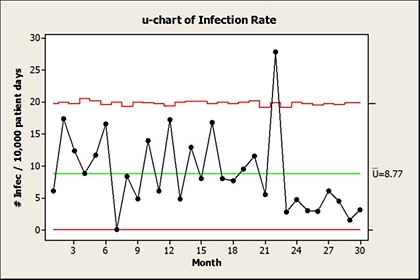
Figure 1: U-chart of infection rate
“It’s obvious I need to investigate that special cause at month 22. And month seven got a zero! But since it’s right on the limit, it would probably be advantageous to investigate it anyway, right?”
…
Comments
We agree!
We agree. Don’t get caught up in minutiae, and don’t let perfect be the enemy of good.
2nd class chart
Davis, You talk about XmR as though it is a "2nd class" chart with words like "approximates". As Dr Wheeler noted:As Shewhart wrote in 1943 [17], “Classical statistics start with the assumption that a statistical universe exists, whereas [SPC] starts with the assumption that a statistical universe does not exist.” We can never know the distribution of process data. Therein lies the brilliance of Shewhart Charts ... which is lost on the SS mob.I can't find the reference but I also read from Dr Wheeler wherein he claimed you'd need a PhD in statistics, like him, to determine if it was reasonable to use a p, np, c, u chart in a particular process.Furthermore, if you are taking square roots, or letting some unnecessary software do it for you, you are not control charting correctly. (See Ch3 "Advanced Topics in SPC")Dr Wheeler has shown XmR is great for all situations.
Of course XmR is great for all situations
A lot of my use of the word "approximate" is tongue-in-cheek. I defer to Dr. Wheeler's expertise whenever possible.
Detecting "small" changes quickly
No beef about not obsessing over the use of the "correct" attribute chart in this case. But, I continue to be wary of the idea that all that is needed for SPC are I/MR charts. In many manufacturing cases, we want to detect process changes (e.g. 1-2 sigma shifts) that are not likely to be detected quickly using I-MR charts.
So, I think it's important to consider each process and ask the question, what kind of process change would we be interested in detecting since the purpose of the control charts is to detect process changes. The answer could be very different depending on the risk, current capability, etc.
The answer may lead to using Xbar charts of sufficient sample size to produce signals (and detect changes) in a TIMELY basis, or CUSUM/EWMA charts for individuals.
I think we are too quick to say we must make it simpler for everyone by using using I-MR charts for everything.
Steven: I agree with you!
Thanks for reading and commenting. Many times, manufacturing has unique issues where the use of ICharts exclusively is indeed silly. I'm mainly addressing the rampant expansion of charts into service industries, especially healthcare, where I-MR charts are one's only option.
But, if I may challenge you a bit: I still see people obsessed with the classic "BUT WHAT IF my process goes out of control?" Perhaps put some of that obsession into trying to design processes that are more robust and don't go out of control so often -- and that includes working with suppliers to send more consistent material (or paying more for it!). "WHAT IF" that were the approach instead?
And then there are the problems inherent in using X bar/R (or S) charts -- many people who should understand them don't! This is especially obvious when specification lines are drawn in on them.
Conversations like I describe in my article are rampant on factory floors as well.
I/MR Charts
Davis,
I completely agree on the needed emphasis on process understanding and optimization. Most of our consulting work is applying tools like DOE, Reliability Methods to optimize product designs and processes.
I agree there is a shocking lack of understanding of some basics like how individuals differe from averages, and we make a huge deal in our training classes of how misleading it is to put spec limits on Xbar charts. But I worry that avoiding these tools because they are not understood is to use less effective simpler methods. It just is a cycle of dumbing down.
Great point, Davis!
As usual, an excellent article, Davis. I didn't actually see where you said to use an XmR chart exclusively, just that it does often work.
What I have found effective, given software such as JMP or Minitab, is that if you have counts of items ("binomial" data) or counts of events ("Poisson" data), the XmR chart is more robust to any assumptions associated with it than the P, nP, C or U charts are to the many assumptions associated with them. The XmR chart is an empirical tool that does not rely solely on theory for the calculation of its limits. An nP chart, for example, cannot tell the difference between a data set containing all twos and eighteens and a data set containing all nines and elevens; the averages will (of course) be the same, and so will the limits! That is not true of an XmR chart, that takes its limits empirically from the data.
So, when I have counts of items or events, I will usually run the XmR chart as well as the appropriate count chart. For one thing, the count charts (as Don Wheeler points out) "build up degrees of freedom faster" than XmR equivalents. For that reason, I always use an nP chart with the Red Bead. It also helps to find those cases where a small area of opportunity (denominator) creates what appears to be a special cause in the individuals chart.
Thanks, Rip...
...as always, for your thoughtful additions. I totally agree.
Nice Job, as usual
"There are people who are afraid of clarity because they fear it may not seem profound."
Thanks Davis for a very nice illustration of what is important and what is not.
Thank you, Dr. Wheeler
I appreciate your kind comments. I have so much gratitude for what you have taught me over the years.
Respectfully,
Davis
Add new comment