{domain:"www.qualitydigest.com",server:"169.47.211.87"} Skip to main content

User account menu
Main navigation
  • Topics
    • Customer Care
    • FDA Compliance
    • Healthcare
    • Innovation
    • Lean
    • Management
    • Metrology
    • Operations
    • Risk Management
    • Six Sigma
    • Standards
    • Statistics
    • Supply Chain
    • Sustainability
    • Training
  • Videos/Webinars
    • All videos
    • Product Demos
    • Webinars
  • Advertise
    • Advertise
    • Submit B2B Press Release
    • Write for us
  • Metrology Hub
  • Training
  • Subscribe
  • Log in
Mobile Menu
  • Home
  • Topics
    • 3D Metrology-CMSC
    • Customer Care
    • FDA Compliance
    • Healthcare
    • Innovation
    • Lean
    • Management
    • Metrology
    • Operations
    • Risk Management
    • Six Sigma
    • Standards
    • Statistics
    • Supply Chain
    • Sustainability
    • Training
  • Login / Subscribe
  • More...
    • All Features
    • All News
    • All Videos
    • Contact
    • Training

Where Does the Success-Testing Formula Come From?

Simple formula, not-so-simple answer

Fred Schenkelberg
Wed, 12/16/2015 - 11:55
  • Comment
  • RSS

Social Sharing block

  • Print
Body

The planning of environmental or reliability testing becomes a question of sample size at some point. It’s probably the most common question I hear as a reliability engineer: How many samples do we need?

ADVERTISEMENT

Also, when evaluating supplier-run test results, we need to understand the implications of the results, again based on the number of samples in the test. If the supplier runs 22 samples without failure over a test that replicates the shipping set of stresses, then we need a way to interpret those results.

We often use success testing (no expected or actual failures during the testing) to minimize the number of samples required for a test and still show some level of confidence for a specified reliability level. The basis for success testing is the binomial distribution. The result of the applied stress results in the product either working or not. Binary results.

Recently I received a request to explain where the success-testing sample size formula comes from, or it’s derivation. First here’s the formula:

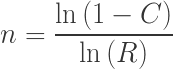
Where, C is confidence and R is the lower limit of the reliability.

 …

Want to continue?
Log in or create a FREE account.
Enter your username or email address
Enter the password that accompanies your username.
By logging in you agree to receive communication from Quality Digest. Privacy Policy.
Create a FREE account
Forgot My Password

Add new comment

Image CAPTCHA
Enter the characters shown in the image.
Please login to comment.
      

© 2025 Quality Digest. Copyright on content held by Quality Digest or by individual authors. Contact Quality Digest for reprint information.
“Quality Digest" is a trademark owned by Quality Circle Institute Inc.

footer
  • Home
  • Print QD: 1995-2008
  • Print QD: 2008-2009
  • Videos
  • Privacy Policy
  • Write for us
footer second menu
  • Subscribe to Quality Digest
  • About Us
  • Contact Us