{domain:"www.qualitydigest.com",server:"169.47.211.87"} Skip to main content

User account menu
Main navigation
  • Topics
    • Customer Care
    • FDA Compliance
    • Healthcare
    • Innovation
    • Lean
    • Management
    • Metrology
    • Operations
    • Risk Management
    • Six Sigma
    • Standards
    • Statistics
    • Supply Chain
    • Sustainability
    • Training
  • Videos/Webinars
    • All videos
    • Product Demos
    • Webinars
  • Advertise
    • Advertise
    • Submit B2B Press Release
    • Write for us
  • Metrology Hub
  • Training
  • Subscribe
  • Log in
Mobile Menu
  • Home
  • Topics
    • 3D Metrology-CMSC
    • Customer Care
    • FDA Compliance
    • Healthcare
    • Innovation
    • Lean
    • Management
    • Metrology
    • Operations
    • Risk Management
    • Six Sigma
    • Standards
    • Statistics
    • Supply Chain
    • Sustainability
    • Training
  • Login / Subscribe
  • More...
    • All Features
    • All News
    • All Videos
    • Contact
    • Training

NBA Lockout: A Look at the Statistics, Part One

Where’s the glitch in getting players and execs to agree?

Andy Cheshire
Mon, 11/14/2011 - 14:03
  • Comment
  • RSS

Social Sharing block

  • Print
Body

Bah! The NBA makes me mad. Seriously, why can’t the basketball players and the execs resolve this current lockout? I want to have something to watch after football season is over. Let’s talk about what is holding up the players and the organizations from agreeing to a decision on how money is distributed.

The National Basketball Association Salary Cap is the limit to how much NBA teams are allowed to pay their players. It was actually first initiated in 1946, but it only lasted that one season. The first modern cap started during the 1984–1985 season, and has been in place ever since. Figure 1 shows a Time Series Plot (Stat > Time Series > Time Series Plot in Minitab Statistical Software) of how the cap has grown throughout the years:

https://lh6.googleusercontent.com/CQZ8bTqEQVrTuxCC1TuPWbBSn7d5S5pzQkz7JdPQTev4gtA1bU12daUNTERLWs3jdsk_sAiRAQBU7S82LDT-nA1tVEFT5iPbsLluHWyoEthgrPrXAHc
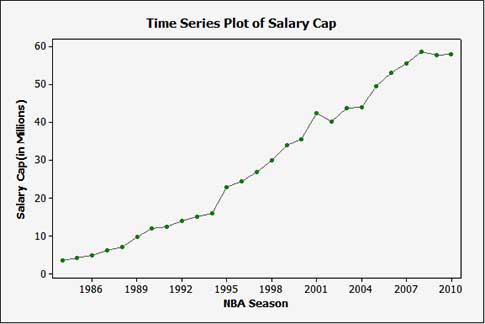
Figure 1: Time series plot of salary cap


 …

Want to continue?
Log in or create a FREE account.
Enter your username or email address
Enter the password that accompanies your username.
By logging in you agree to receive communication from Quality Digest. Privacy Policy.
Create a FREE account
Forgot My Password

Add new comment

Image CAPTCHA
Enter the characters shown in the image.
Please login to comment.
      

© 2025 Quality Digest. Copyright on content held by Quality Digest or by individual authors. Contact Quality Digest for reprint information.
“Quality Digest" is a trademark owned by Quality Circle Institute Inc.

footer
  • Home
  • Print QD: 1995-2008
  • Print QD: 2008-2009
  • Videos
  • Privacy Policy
  • Write for us
footer second menu
  • Subscribe to Quality Digest
  • About Us
  • Contact Us