Featured Product
This Week in Quality Digest Live
Six Sigma Features
Douglas C. Fair
Part 3 of our series on SPC in a digital era
Scott A. Hindle
Part 2 of our series on SPC in a digital era
Donald J. Wheeler
Part 2: By trying to do better, we can make things worse
Douglas C. Fair
Introducing our series on SPC in a digital era
Donald J. Wheeler
Part 1: Process-hyphen-control illustrated

More Features

Six Sigma News
How to use Minitab statistical functions to improve business processes
Sept. 28–29, 2022, at the MassMutual Center in Springfield, MA
Elsmar Cove is a leading forum for quality and standards compliance
Is the future of quality management actually business management?
Too often process enhancements occur in silos where there is little positive impact on the big picture
Collect measurements, visual defect information, simple Go/No-Go situations from any online device
Good quality is adding an average of 11 percent to organizations’ revenue growth
Floor symbols and decals create a SMART floor environment, adding visual organization to any environment
A guide for practitioners and managers

More News

Donald J. Wheeler

Six Sigma

Problems With Gauge R&R Studies

How to make sense of your repeatability and reproducibility (R&R) values

Published: Monday, January 3, 2011 - 04:30

Measurement error is ubiquitous. As a result, over the past 250 years, different areas of science and engineering have come up with many different ways to deal with the problem. One approach to the problem of measurement error was developed during the 1960s within General Motors. Throughout the years it was modified and revised, until in 1989, it was turned over to the Automotive Industry Action Group (AIAG). Since that time, the AIAG gauge repeatability and reproducibility (R&R) study has been promoted throughout many different industries. Unfortunately, the original procedure contained some fundamental problems that have not been corrected over the years. This column will address these historic problems and suggest solutions.

The AIAG gauge R&R study

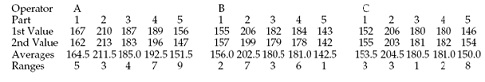
The gauge R&R study starts out with a sound strategy for collecting data. A simple fully-crossed experiment is performed where two or more operators measure each of three to 10 parts two or three times apiece. To have an example, we will use the data shown in figure 1 where three operators measure each of five parts two times apiece.

Figure 1: The gasket thickness data


The average and range are shown for each of the 15 pairs of measurements in figure 1. Since each of these pairs represents the same operator measuring the same part, the ranges characterize the basic component of measurement error. This component has many names. Among these are test-retest error, repeatability, and equipment variation. This component may be estimated by dividing the average range by the appropriate bias correction factor d2:

Formula 1:

Next, under the assumption that the operators are different, an estimate of the reproducibility is obtained by computing an average value for each operator and finding the range of these averages. Here the operator averages are 181.0, 172.5, and 173.9 and the range of these three averages is Ro = 8.5 mils. This range value is divided by a bias correction factor for the range of three values, d2* = 1.906, and then, with o = number of operators, p = number of parts, and n = number of repeated measurements, the reproducibility is estimated to be:

Formula 2:

Once we have an estimate of both the repeatability and the reproducibility, we can combine them to estimate the combined R&R component as:

Formula 3:

Next the product variation is estimated by computing averages for each of the p parts and using the range, Rp. Here the five-part averages are 158.0, 206.167, 182.0, 184.833, and 148.0. The range for these part averages is Rp = 58.167. The bias correction factor used is d2* = 2.477, which is for one range of five values. The product variation is estimated to be:

Formula 4:

Finally, the total variation for the set of product measurements is estimated by combining the repeatability, the reproducibility, and the product variation to get:

Formula 5:

Up to this point everything is okay. While the estimators defined here are not the only formulas that could have been used, and while they are not always unbiased estimators, they do provide reasonable estimates for the quantities described. (While the AIAG gauge R&R computational worksheet simplifies the formulas by defining several “K-factors,” the AIAG formulas are algebraically equivalent to formulas 1–5.)

The train wreck begins when the AIAG gauge R&R study tries to use the estimates from formulas 1–5 to characterize relative utility. In the current version the first four quantities are all expressed as a percentage of the total variation from formula 5.

The “percentages” of the total variation

The repeatability (formula 1) is divided by the total variation (formula 5) and multiplied by 100 to be expressed as a percentage. This ratio is said to represent the percentage of the total variation that is consumed by repeatability. Here we find:

Formula 6:

Next the reproducibility (formula 2) is divided by the total variation (formula 5) and multiplied by 100. This ratio is said to represent the percentage of the total variation that is consumed by reproducibility. Here we find:

Formula 7:

The combined repeatability and reproducibility (formula 3) is divided by the total variation (formula 5) and multiplied by 100. This ratio is said to represent the percentage of the total variation that is consumed by the combined repeatability and reproducibility. Here we find:

Formula 8:

Finally, the product variation (formula 4) is divided by the total variation (formula 5) and multiplied by 100. This ratio is said to represent the percentage of the total variation that is consumed by the product variation. Here we find:

Formula 9:

Following these ratios, the current version of the AIAG manual has a simple statement to the effect, “The sum of the percent consumed by each factor will not equal 100%.” This statement has no explanation attached. There is no guidance offered on how to proceed now that common sense and every rule in arithmetic have been violated. Just a simple statement that these numbers do not mean what they were just interpreted to mean, and the user is left to his or her own devices. Unfortunately, unlike the Red Queen in Wonderland, when it comes to arithmetic we do not get to say that things mean whatever we want them to mean.

Why these “percentages” do not add up

The repeatability percentage of formula 6 and the reproducibility percentage of formula 7 do not add up to the combined repeatability and reproducibility percentage of formula 8 because they are not proportions. Likewise, the combined R&R percentage of formula 8 and the product variation percentage of formula 9 do not add up to 100 percent because they are not proportions. Instead of being proportions, it turns out that the quantities computed above are all trigonometric functions. Figure 2 shows how the five estimates of variation are related.

Figure 2: The five estimates of variation


Thus, based on figure 2, and recalling some of our high school trigonometry, we see that the ratio of the repeatability to the total variation is:

The ratio of the reproducibility to the total variation is:

The ratio of the combined repeatability and reproducibility to the total variation is:

And the ratio of the product variation to the total variation is:

In this form we can begin to see why these quantities do not add up. While they were dressed up to look like proportions, and while they were interpreted as proportions, they are, and always have been, nothing more than trigonometric functions. And trigonometric functions do not satisfy the conditions required for a set of ratios to be interpreted as proportions.

A set of ratios will be proportions only when the denominator is the sum of the numerators. This additivity of the numerators is the essence of proportions. So what is additive in a gauge R&R study? Look at the structure of formula 5. It is the variances that are additive:

Total Variation2 = Repeatability2 + Reproducibility2+ Product Variation2

Because these variances are additive, we know from the Pythagorean Theorem that the standard deviations cannot be additive. However, the ratios computed by the AIAG gauge R&R study implicitly assume that the standard deviations are additive. This implicit assumption of additivity is a violation of the Pythagorean Theorem, and is what makes it impossible to make sense of the ratios in the AIAG gauge R&R study. This is why the percentages of ratios in formulas 6 through 9 do not add up, and this is why engineers have told me they never could figure out exactly what the final numbers in a gauge R&R study represented. The ratios sound like nonsense simply because it is nonsensical to interpret trigonometric functions as proportions.

So what are the actual proportions?

Formula 5 above suggests the solution to the problem of how to characterize the contribution of the various components to the total variation in the product measurements. For example, the repeatability contribution to the total variation could be estimated by:

Honest ratio 6:

which is 2.45 percent rather than the 15.65 percent erroneously found earlier. The reproducibility contribution to the total variation could be estimated by:

Honest ratio 7:

which is 3.16 percent rather than the 17.77 percent erroneously found earlier. The combined repeatability and reproducibility contribution to the total variation could be estimated by:

Honest ratio 8:

which is 5.61 percent rather than the 23.68 percent erroneously found earlier. We also should note that this 5.61 percent is the sum of the 2.45 percent and the 3.16 percent, which is what we expect when computing proportions. The product variation contribution to the total variation could be estimated by:

Honest ratio 9:

which is 94.38 percent rather than the 97.15 percent erroneously found earlier. When this value is added to the combined R&R percentage we effectively get 100 percent. Now we have correctly accounted for the various components of the variation in the product measurements.

Honest Ratio 9 is the traditional measure of relative utility introduced by Sir Ronald Fisher in 1921. In this context it is commonly known as the intraclass correlation. Here the value of 0.9438 tells us that more than 94 percent of the variation in the product measurements is attributable to the variation in the product stream, and less than 6 percent of the variation in the product measurements is attributable to variation in the measurement system (combined R&R). Thus, this one number summarizes the essential information contained in all four of the honest ratios above and provides a characterization of the relative utility of the measurement system for measuring a particular product.

So what should you do?

Since any attempt to use ratios 6 through 9 from the AIAG gauge R&R study is a violation of the Pythagorean Theorem, you will need to convert the ratios into the correct quantities shown as honest ratio 6 through honest ratio 9 before attempting to interpret or use them in any manner. No exceptions. No loopholes. No excuses.

The “percentages” of the specified tolerance

The ratios in formulas 6 through 9 were added to the General Motors gauge R&R study in its 1984 revision. Prior to 1984 there were only three ratios. These compared the repeatability (formula 1), the reproducibility (formula 2), and the combined R&R (formula 3) to the specified tolerance.

Assume that the specifications for the gaskets of figure 1 are 145 mils to 225 mils. How much of this specification range is “lost” due to measurement error? In an attempt to answer this question the GM gauge R&R study multiplied the repeatability by 5.15 (presumably to account for 99% of the measurement error), divided by the specified tolerance, and then multiplied by 100 to express the result as a percentage. In an attempt to account for more than 99 percent of the measurement error, the AIAG gauge R&R study eventually changed the initial multiplier from 5.15 to 6.00. Thus, the following ratio is said to represent that amount of the specified tolerance that is consumed by repeatability:

Formula 10:

In a similar manner, reproducibility is said to consume the following amount of the specified tolerance:

Formula 11:

However, the combined repeatability and reproducibility is said to consume the following amount of the specified tolerance:

Formula 12:

Once again, these three ratios suffer from the same lack of additivity that corrupted the ratios in formulas 6, 7, 8, and 9. Since these ratios cannot all be right, they must all be wrong. Moreover, since reproducibility cannot occur except in conjunction with repeatability, the ratio in formula 11 is not only incorrect, but it also would not make any sense even if it were correct.

As we saw in my columns in June and July, “Is the Part in Spec?,” and “Where Do Manufacturing Specifications Come From?,” the appropriate way to adjust the specifications for measurement error is to use manufacturing specifications. When we use the approach given there we find that, based on the repeatability alone, the 99 percent manufacturing specifications are 152 mils to 218 mils, which represent a loss of only 17 percent of the specified tolerance, rather than the 28 percent erroneously computed above.

Using the combined R&R, the 99 percent manufacturing specifications become 156 mils to 214 mils, which represents a loss of 27 percent rather than the 43 percent erroneously computed above.

Thus, as with the erroneous ratios in formulas 6 through 9 that are based on the total variation, the AIAG ratios in formulas 10, 11, and 12 that are based on the specified tolerance also overstate the damage due to measurement error. This point is especially important in the light of the widespread use of the precision to tolerance (P/T) ratio. The P/T ratio for the data of figure 1 is:

which is the same as the erroneous ratio from formula 12 from the AIAG study divided by 100. And just like ratio 12, the P/T ratio overstates the damage due to measurement error without providing any useful information on how to adjust the specifications for measurement error.

The “number of distinct categories”

Finally, the AIAG gauge R&R study computes a quantity it calls the “number of distinct categories (ndc)” using the formula:

Formula 13:

The AIAG manual suggests rounding this value off to an integer, and that values of 5 or greater are “good.” (Simple algebra will show that this value is inconsistent with the guidelines given below, but inconsistencies of this sort are found throughout the AIAG manual.)

The citation given in the AIAG manual for formula [13] is in the first edition of Evaluating the Measurement Process by myself and Richard Lyday. In that text we defined a quantity which we called the classification ratio, and the formula above does provide an estimate of this classification ratio. However, nowhere in that text did we ever suggest that this ratio would define the number of distinct categories.

Unfortunately, as I has discovered after much effort, there is no simple interpretation for the classification ratio in practice. While the classification ratio does approximate the relative sizes of the major and minor axes in the intraclass correlation plot, this plot does not lend itself to any practical interpretation. So while the ratio given in formula 13 does describe one aspect of a particular plot of the data, neither that plot, nor formula 13, provide any practical characterization of the number of distinct categories for the product.

The guidelines

In spite of the many revisions made in the Gauge R&R Study over the years the guidelines for interpreting the proportions that are not really proportions has remained unchanged. Whether they were applied to the ratios in formulas 6, 7, or 8, or were applied to the ratios in formulas 10, 11, or 12, the guidelines have always been:

• Ratios that are less than 10 percent are said to be good.
• Ratios that between 10 percent and 30 percent are said to be marginal.
• Ratios that exceed 30 percent are said to be unacceptable.

Using these guidelines we would interpret the ratios computed earlier, as shown in figure 3.

Figure 3: Interpreting the results for the gauge R&R study for gasket thickness

Here we find that the measurement system used to measure the gaskets in figure 1 is simultaneously marginal, unacceptable, and good! Any questions?

While the ratios 6, 7, and 8 have the same numerators as ratios 10, 11, and 12 respectively, they have different denominators. In spite of these different denominators, the same guidelines are used for each set of ratios in the AIAG Gauge R&R Study. This is presumably one of the benefits of using guidelines that have absolutely no contact with reality. Since no justification for these guidelines exists, they can be adapted to fit any set of ratios that might be computed. After all, when attempting to interpret patent nonsense, it is always best to use arbitrary guidelines.

The inconsistency of the results in figure 3 is an inherent feature of the AIAG gauge R&R study. Once you ignore the Pythagorean Theorem, mere guidelines are not going to remedy the situation. After finding reasonable estimates for repeatability, reproducibility, combined R&R, product variation, and the total variation with formulas 1 through 5, the eight ratios (6 through 13) computed in the AIAG gauge R&R study are erroneous, fallacious, naive, incorrect, and, to put it quite simply, wrong.

But how do these guidelines match up with the four classes of process monitors?

In my December column, “The Intraclass Correlation Coefficient,” we looked at how the intraclass correlation coefficient could be used to define four classes of process monitors. To see how the gauge R&R guidelines compare with the four classes of process monitors we need to begin by noting that the ratio in formula 8 is 100 times the following:

Thus, if we plotted values for ratio 8 on one scale (in ascending order), and plotted values for the intraclass correlation on another scale (in descending order) we could connect equivalent points on the two scales to get figure 4.

Figure 4: The AIAG guidelines and the four classes of process monitors

The AIAG gauge R&R guidelines will pronounce a measurement system to be good only when it has an intraclass correlation in excess of 0.99; marginal measurement systems will have an intraclass correlation between 0.91 and 0.99; and everything else is “in need of improvement.” Contrast this to the results from last month’s column which are summarized in figure 5. There we see that even third-class monitors can be used to track process improvements.

Figure 5: The four classes of process monitors defined by the intraclass correlation

When we compare the results in figures 4 and 5, it becomes clear that the main purpose of the AIAG gauge R&R study is to condemn the measurement process. To achieve this end the summary ratios from formulas 6 through 12 are inflated so as to overstate the damage of measurement error while the guidelines used to interpret these inflated ratios are excessively conservative.

So what can you learn from the AIAG gauge R&R study? Virtually nothing that is true, correct, or useful! You have taken the time and gone to the trouble to collect good data, and then you have wasted the information contained in those data by performing a hopelessly flawed analysis.

Summary

The Pythagorean Theorem would need to be repealed before the summary ratios 6 through 12 of the AIAG gauge R&R study could even begin to make sense. Since that is unlikely to happen anytime soon, you need to stop using the erroneous ratios of the AIAG gauge R&R study.

The number of distinct categories value from ratio 13 does not represent anything that can be expressed in practical terms. So even though I may be the author of this ratio, it is useless in practice. I personally quit using it back in the 1980s. I suggest that you do the same, starting immediately.

The erroneous ratios 10, 11, and 12 overstate the impact of measurement error upon specifications. Manufacturing specifications provide a way to adjust the specifications to make allowances for measurement error that is both theoretically sound and easy to implement. The use of manufacturing specifications will eliminate the need to compute the erroneous ratios 10, 11, and 12 as well as the related precision to tolerance ratio.

Honest ratio 6 through honest ratio 9 replace the erroneous ratios 6 through 9. Honest ratio 9 is an estimate of the traditional, theoretically sound, intraclass correlation coefficient which was introduced in my July column and explained more fully in my December column.

Because many software packages currently give these nonsense ratios as part of any “measurement system analysis,” you will need to identify these fallacious numbers on the output in order to avoid being misled by them.

This paper and my earlier papers provide you with practical, theoretically sound, and easy-to-use alternatives to the nonsense ratios of the AIAG gauge R&R study. They allow you to learn and use the correct formulas for evaluating the measurement process. Further documentation and explanation can be found in my book EMP III: Evaluating the Measurement Process and Using Imperfect Data.

However, if you still want to obfuscate and confuse the issues, if you want to needlessly condemn measurement systems, and if you want to continue to beat vendors over the head, then by all means continue to use the AIAG gauge R&R study.

Discuss

About The Author

Donald J. Wheeler’s picture

Donald J. Wheeler

Dr. Wheeler is a fellow of both the American Statistical Association and the American Society for Quality who has taught more than 1,000 seminars in 17 countries on six continents. He welcomes your questions; you can contact him at djwheeler@spcpress.com.


Comments

Quality

I'm  newbie  here,  i conducted   gage  type 1  study  on CMM &  analysis  the data  on minitab but results  are not  so good. 
i have a little bit  confusion  about  tolerance, i ran  a master  ring  gage 25 times,  having diameter  200.001mm & record the data.  in minitab,  enter   the data in measurements  column & software 
  ask also put tolerance  value.  tolerance  value of what,   CMM  tolerance  or master  ring gage tolerance? CMM accurcy is +-0. 05mm & Master  ring  gage  tolerance  is 0.001mm

thanks  in advance 

Regards 

Aslam  abbas 

Gauge R&R studies

Thank you for your article.  I have wondered why the measurement error sources never added up to 100% for years, and I have struggled to understand why a gauge that measures at 9% is 'acceptable' while '11%' is not.  For that matter, I could never figure out how a gage would be unacceptable when part variation would be 90% plus of the observed variation.  Thanks for the insight.

Uncareful R&R use

There are further examples of uncareful R&R studies, especially in the automotive industry, where the AIAG's manual is literally read but not always understood, which is destructive testing. Though expensive they are, destructive tests are used more and more often for safety components and for components made of plastic or rubber or that are kept together by adhesives. Only the latest AIAG's manual warns not to rely on R&R studies for these measures, of course, but, once again, form takes over substance. I'm personally not in favor of R&R studies to test the reliability of a measuring system, I would rather break it down to its components, that is devices, people, methods and environment, which are much easier to audit and to repair, were it the case. But I'm not an AIAG ruler, so I've to go along. Mr. Wheeler is right when raising doubts about the validity of R&R studies, it's high time; for too long their reliability has been taken for granted.

Link this Article

Dr. Wheeler,

I admire the way you call out and fix flawed methodologies. Fairly recently, you wrote about, but didn't identify, a software package that had some fundamental errors. Do you know if they've been corrected?

May I link this article on LinkedIn?

Problem with Gauge Studies

Don, I respect your work especially your SPC text, but your continued rant about the AIAG method is dishonest. It is time for it to stop.

First, if you've done your homework you understand why Standard Deviation, not variance was used at the onset of Gauge Studies. It was 1962 and the error involved with doing calculations by hand was greater than the error with using r-bar to estimate s (or s^2). So your "honest" method just squared the result. Wow, you must be a genius! 

And your talking down to us about a + b does not equal c is just plain arrogance.

The problem with your rant is you have no way to deal with the adequacy of a measure where there is a specification. you think that industry just cares about control charts. You can tell you are just an academic.

Your writings are used as an excuse to avoid the hard work of getting an adequate measure by a bunch of lazy MBB's and others. Anyone who has ever used the AIAG methods and found that they can solve unsolvable problems knows your writing in nonsense.

Just my experience.

Persoanl attacks

People making such personal and unprofessional attacks on Dr Wheeler, with words such as "rant", should have the kahoonas to state their name.

d2*

Dr. Wheeler,

           I've been reading through your paper(I am somewhat new to R&R) and I've been finding it extremely helpful in getting myself up to speed with what I need to know. For that, I am very thankful. My only issue, and I'm hoping it proves to be a misinterpretation or misunderstanding of the material on my part, is where you get the number 1.906 as the value for d2*. I'm not questioning it's validity in the formula; more so, where can I find such a table of constants?(to aid in practical application on other potential sets of data) Again, I feel as though this may be some kind of misinterpretation of what I'm reading, so any bits that can help me over this hurdle would be greatly appreciated! Thanks! 

Answer for George

I presented a paper with most of this information to the AIAG group at an ASQ world conference in 1992. They gave me a award and changed very little in the procedure.

Donald J. Wheeler, Ph.D.
Fellow American Statistical Association
Fellow American Society for Quality

AIAG Gauge R&R Feedback

Interesting article. I am curious as to whether any of this has been communicated to the AIAG and what their response is.

Performing this in Minitab

The method Dr. Wheeler is describing is the "Xbar-R Method" in Gage R&R (Crossed) in Minitab and the "honest" ratios are presented as well as the AIAG ratios. The "honest" ones are in the %Contribution column presented first, and the AIAG ratios are presented as %Study Var in the next table.

For what it's worth, I believe most practitioners with stat software are currently using the ANOVA method and not Xbar-R, but the concepts of additivity among %Contribution as compared to %Study Var hold true just the same. I believe the only attractive propoerty of %Study Var is that it is in the original units of the data and at least in that dimension has an easier interpretation, but without a firm understanding of the underlying formulas and concepts the correct interpretation of each is likely lost.

Semiconductor Industry white papers available

The member companies of ISMI (the manufacturing subsidiary of SEMATECH, the semiconductor industry consortium) have written a white paper to aid companies in our industry to deal with auditors who insist on using AIAG guidelines, even though the MSA Manual states they are only guidelines. We have found that often both internal and external auditors insist on the use of AIAG methods, even though Don Wheeler and others have shown that there are superior measures of the goodness of a measurement system. The white paper can be downloaded free of charge via http://www.sematech.org/docubase/abstracts/35939.htm.

A corresponding white paper for use with SPC system auditors can be found at http://www.sematech.org/docubase/abstracts/35938.htm.

GRR Software

GagePack by PQ Sysyems has already incorporated Don's EMP III methods as part of their calibration software.

Rich DeRoeck

Gauge R and R

Thanks for the excellent article. It was timely and have already forwarded it to colleagues who are starting to get the message.

Software

May I suggest also posing this to Minitab and JMP, to allow for alternate calculations in their software?

Don't get me started!

I recommend doing some simulation work, and then you will discover a few things.

1) The use of the d2* constant was developed for variances. When you use this constant to estimate a standard deviation, you get a biased result. It will show up especially in the attempt to determine reproducibility, where it is generally quite significant. The d2 number should actually be used instead. If you are trying to estimate the variance from a range, or a group of ranges, use d2*, but if you are trying to estimate a standard deviation, use d2. This depends on your research question, and what you wish to do with the numbers generated.

2) Any attempts at determining measurement error as a proportion of observed total variation in a measurement study is bogus, and has no external validity. The problem is the sampling method and the sample size. First, I contend that you should not be taking a random sample of items, but a stratified (non-random) sample to exercise the full range of the measurement system. There is other analysis that you need to do, such as determining measurement error as a function of item size. You certainly want to look at product near your specification ranges, and how the measurement system behaves in those regions. Taking a "random sample" could be quite misleading.

The second problem is the sample size used. Just look at the confidence intervals for variances and standard deviations with a sample size of 10 (a size often used in an "R&R" study)! The sampling error is so large, that any attempt at estimation if futile.

3) And finally, as I looked at 1000's of measurement system applications in industry, in many cases, "reproducibility" should really be treated as a "fixed" factor. That is a complete different analysis, and study. In the case of a fixed factor, you are not interested in estimating the variance from operator/system to operator/system, you are interested in estimating the bias between operators/systems. Often, this is much more useful.

Michael Petrovich's comments

Michael Petrovich is right about the origin and use of d2*. The inconsistent use of d2 and d2* is part of the AIAG study. I did not recommend these formulas, but merely presented the formulas used by AIAG. In my EMP book I present a table of formulas for estimators of various quantities which lists 12 alternatives for the three basic variances involved. However, when using the adjustment terms shown for repeatability, we are estimating a variance, and so d2* is appropriate. We could also take exception with the way the AIAG study uses adjustment terms for Repeatability and yet fails to use adjustment terms for the product variation (where it inappropriately uses d2*).

On the second point, I will refrain from agreeing that the intraclass correlation is "bogus." It is the correlation between two measurements of the same item. It is theoretically sound, and it provides a way to characterize the relative utility of a measurement system for a given application. However, I did not address the issue of how the parts are selected. In my EMP book I discuss and illustrate systematic samples, grab samples, and other types of sampling with EMP Studies. The structure of the data in an R&R study will result in a decent estimate of measurement error, but it will give you a soft estimate of the product variation (9 d.f. or less). This means that there will be a lot of uncertainty in any of the ratios computed. In my book I also discuss how to solve the problem of a lack of degrees of freedom for the product variation estimate.

I am aware of the differences in fixed and random effect analysis. I deal with these differences in my EMP book where I show how to detect and estimate operator biases. However, the AIAG gauge R&R study simply assumes that the operators are different and that they are a random effect. Since I had already shown the R&R study to be inappropriate in so many other ways, I did not go on to address this issue in this paper in the interest of simplicity.

Good question

I'm hoping Don will weigh in. I remember taking the EMP workshop years ago, and Don told us he had presented this paper at an AIAG or ASQ working group, and they just stared blankly at him...
On the hopeful side, I ran into some British and German engineers a few years ago, and they told me that they had abandoned AIAG GR&R and were all exclusively using Wheeler's EMP.

Comment on Problems with Gauge R&R Studies

This sure changes how I view the many results that I have had to deal with that were less than the current AIAG Gauge R&R requirements.

However, the real question is: How do you convince customers that are ingrained in the AIAG Gauge R&R process that they need to change how they require the results to be calculated? Or is it to convince the AIAG group to change their published documents?

Kim Howarter
Revcor, Inc.
Carpentersville, IL

Kim's Question

The only alternative to ignorance is education. You might start by showing them a copy of this paper.
Hope this will help.