{domain:"www.qualitydigest.com",server:"169.47.211.87"} Skip to main content

User account menu
Main navigation
  • Topics
    • Customer Care
    • FDA Compliance
    • Healthcare
    • Innovation
    • Lean
    • Management
    • Metrology
    • Operations
    • Risk Management
    • Six Sigma
    • Standards
    • Statistics
    • Supply Chain
    • Sustainability
    • Training
  • Videos/Webinars
    • All videos
    • Product Demos
    • Webinars
  • Advertise
    • Advertise
    • Submit B2B Press Release
    • Write for us
  • Metrology Hub
  • Training
  • Subscribe
  • Log in
Mobile Menu
  • Home
  • Topics
    • 3D Metrology-CMSC
    • Customer Care
    • FDA Compliance
    • Healthcare
    • Innovation
    • Lean
    • Management
    • Metrology
    • Operations
    • Risk Management
    • Six Sigma
    • Standards
    • Statistics
    • Supply Chain
    • Sustainability
    • Training
  • Login / Subscribe
  • More...
    • All Features
    • All News
    • All Videos
    • Contact
    • Training

Short Run SPC, Part 1

Tracking the process while making different products

Donald J. Wheeler
Mon, 12/02/2019 - 12:03
  • Comment
  • RSS

Social Sharing block

  • Print
All articles in this series
Short Run SPC, Part 1
Short Run SPC, Part 2
Short Run SPC, Part 3
Short Run SPC, Part 4
Body

Lean production is built on the explicit assumption that each step is operated predictably and capably. Predictable operation can only be achieved and maintained by using process behavior charts. But short production runs and multiple products make it hard to see how to use process behavior charts in a lean environment. So what can be done? This paper will show how to use a zed chart for individual values to track your process while it is making different products.

ADVERTISEMENT

Unit 12

Unit 12 is used to make Products 1201 and 1202. The final characteristic for Product 1201 has a target value of 19.0, while the final characteristic for Product 1202 has a target value of 8.0. Batches 43 through 72 contain short runs of both products.


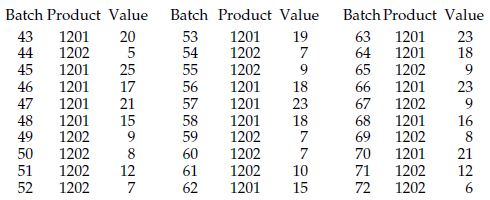
Figure 1: Data for Unit 12

Of course a naive approach would be to simply place the data from Unit 12 on an XmR chart as shown in figure 2.

 …

Want to continue?
Log in or create a FREE account.
Enter your username or email address
Enter the password that accompanies your username.
By logging in you agree to receive communication from Quality Digest. Privacy Policy.
Create a FREE account
Forgot My Password

Add new comment

Image CAPTCHA
Enter the characters shown in the image.
Please login to comment.
      

© 2025 Quality Digest. Copyright on content held by Quality Digest or by individual authors. Contact Quality Digest for reprint information.
“Quality Digest" is a trademark owned by Quality Circle Institute Inc.

footer
  • Home
  • Print QD: 1995-2008
  • Print QD: 2008-2009
  • Videos
  • Privacy Policy
  • Write for us
footer second menu
  • Subscribe to Quality Digest
  • About Us
  • Contact Us