
Social Sharing block
The Weibull distribution is a continuous probability distribution often used in reliability analysis to model time-to-failure and product lifespans.
|
ADVERTISEMENT |
It has applications in engineering, medicine, energy, and insurance. It’s also good at describing survival statistics, such as survival times after cancer diagnosis or electric bulb failure times. It’s used in the pharmaceutical industry to compare the in vitro dissolution profiles to establish dissolution similarity.
The two parameter Weibull distributions are characterized by a scale parameter and a shape parameter. Several methods are used to estimate the parameters and their confidence intervals. Maximum likelihood estimation (MLE) is a rigorous mathematical approach used to estimate the Weibull distribution parameters.
The pdf (probability density function) of two-parameter Weibull distribution is given by:
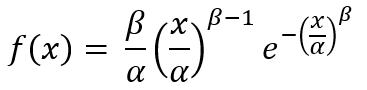
Equation 1
where x ≥ 0
β > 0, is the shape parameter
α > 0, is the scale parameter
The likelihood function is given by:
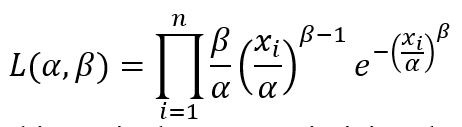
Equation 2
Maximizing the likelihood is equivalent to maximizing the log likelihood:
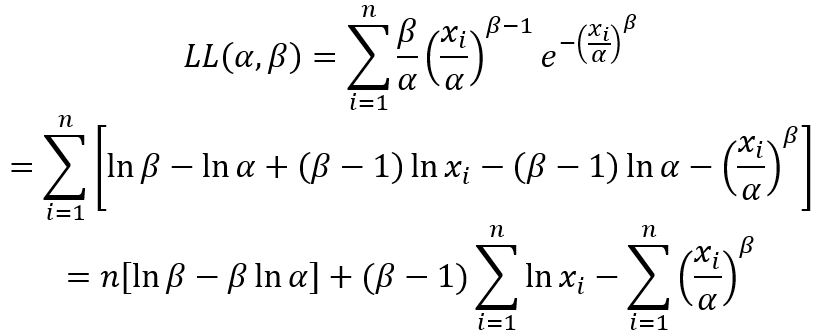
Equation 3
The values of α, β can be obtained by maximizing the value of log likelihood in Microsoft Excel using Solver add-in. The initial values for α, β can also be obtained by using the estimates from method of moments.
Likelihood ratio confidence intervals
They are calculated by finding the values α, β that satisfy the following equation:
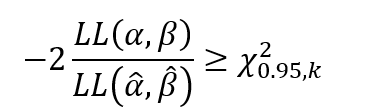
Equation 4
where LL(α, β) = likelihood function f
![]() = likelihood function calculated using Weibull distribution parameter values obtained using MLE
= likelihood function calculated using Weibull distribution parameter values obtained using MLE
![]() = chi-square value with k degrees of freedom at 95% confidence level. In case of joint confidence intervals, k has a value of 2.
= chi-square value with k degrees of freedom at 95% confidence level. In case of joint confidence intervals, k has a value of 2.
The 95% confidence intervals obtained using likelihood ratio can also be expressed as:
Equation 5
Data Tables in Microsoft Excel
Data Tables is a tool widely used in Microsoft Excel model to track how changes in the input affect the results in the model that are dependent on those inputs. Two variants of data table options are available in Microsoft Excel. In this article a two-variable data table is used, which allows the use of two variables into a single formula. The advantages of using a data table include the ability to use a specific range of values as inputs into a formula, and comparing all the possible outcomes at once. The examples describing the use of one- and two-variable data tables can be found here. The use of the Microsoft Data Tables tool along with the likelihood ratio to compute confidence intervals is a novel approach that has not been reported so far.
Data used for analysis
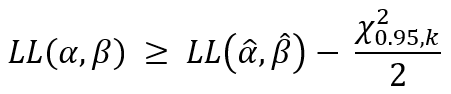
The dataset in Figure 1 are times-to-failure for a given product. Weibull distribution parameters and their confidence intervals were estimated using likelihood ratio method.
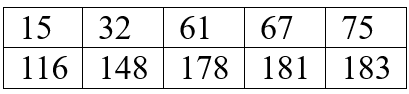
Figure 1: Times-to-failure for a product with new design.
The data were fitted using two-parameter Weibull distribution with maximum likelihood estimation method based on Equation 3, and the parameters values obtained were in agreement with reported values. The confidence intervals of the parameters are calculated by finding the extreme values of contour plot on each axis at a specified confidence level. The boundaries of the contour plot generated using extreme values of parameters are represented by Equation 5.
Estimation of confidence intervals using Data Table
Refer to the Excel table available here.
1. Using the fill series option: Home > Fill > Series > Series in Columns > Step Value (0.05) and Stop Value (4)—numbers from 0.05 to 4 are entered into cells H5 to H84.
2. Using the fill series option: Home > Fill > Series > Series in Rows > Step Value (5) and Stop Value (225)—numbers from 5 to 225 are entered into cells I4 to BA4.
3. Set cell H4 value to -54.8277, which corresponds to the MLE value.
4. After selecting cells H4 to BA84, the Data Table tab Home > Data > What-If Analysis > Data Table was selected.
5. In the Data Table dialog box, α was selected for the row input E3 cell, and β was selected for the column input E4 cell. The values for α and β correspond to parameter values obtained from the MLE.
6. This calculates different MLE values for different combinations of α and β values as shown in Figure 1 .
7. Using conditional formatting, cell values that are greater than or equal to -54.8277 are highlighted. The highlighted lowest and highest values on both axes correspond to the confidence intervals of these parameters. Figure 2 shows the contour plot obtained after conditional formatting of Data Table cells greater than or equal to MLE. These obtained values can be further refined by either using Goal Seek or the Solver add-in.
Weibull parameters confidence intervals for censored data
Right-censored data involve instances where the test components didn’t fail at the end of the test period. In such cases, the log likelihood is given by the following equation:
Equation 6
where m = number of samples that didn’t fail at the end of test period
t = test time period
n = number of failed samples during the test period
Weibull distribution was fitted to the following test data, which also include two components that didn’t fail during the test period of 900 hours.
Figure 2: Components failure data in hours.
Results
The parameter values and 95% confidence intervals for the new design are given in Figure 3. The parameter values and 95% confidence intervals for censored data are given in Figure 4.
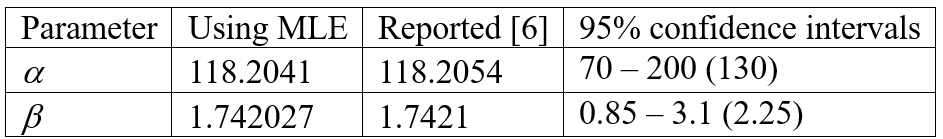
Figure 3: Weibull parameters confidence intervals estimated from the method described in the manuscript. The values in the parentheses correspond to the width of confidence intervals.
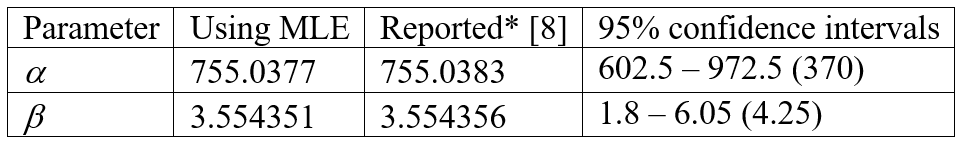
Figure 4: Comparison of Weibull parameters confidence intervals estimated from different methods. The values in the parentheses correspond to the width of confidence intervals.
(*Obtained using Newton method)
The method described demonstrates the utility of Microsoft Excel to estimate Weibull parameters and its confidence intervals. The likelihood ratio method is less computationally intensive; the other advantage is that the confidence intervals can be noticed visually. The confidence intervals obtained using this method were found to be comparable to those obtained by using a specialized software.

Figure 5: Computation of Weibull parameters for data in Figure 1 using MLE and subsequent estimation of confidence intervals using likelihood ratio method.
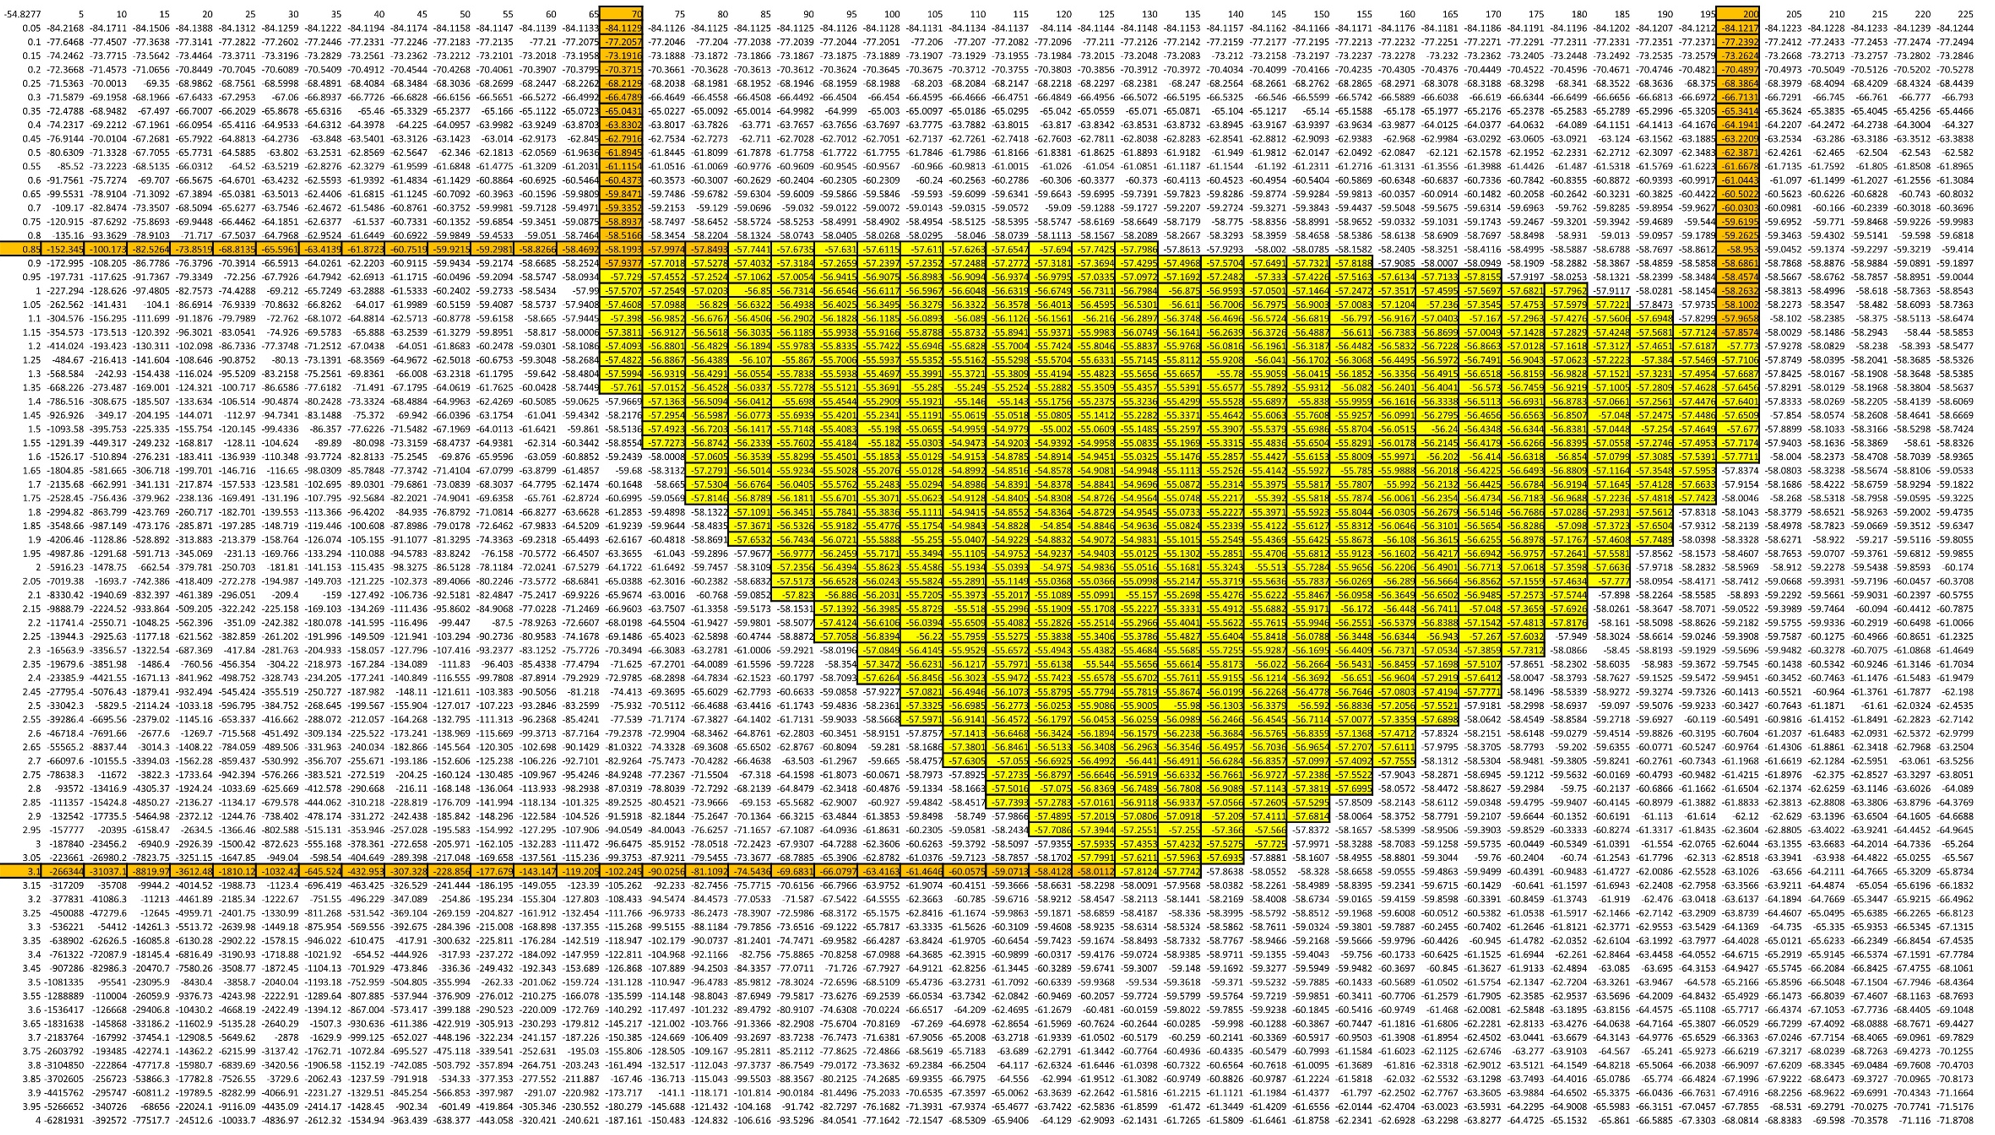
Figure 6: Contour plot obtained from likelihood ratio for data from Figure 1. Vertical and horizontal color bars represent the 95% confidence intervals. Log likelihood values meeting the criteria in Equation 5 are colored using conditional formatting.
Comments
Do-It-Yourself Weibull Analysis
DIY Weibull analysis in Excel is like DIY brain surgery--complicated and messy and error-prone
Get SPC software such as Minitab, JMP or QI Macros and use the Weibull analysis tool.
Saves time and gives better results.
Add new comment