Social Sharing block
Many erroneously think of a process behavior chart as a technique for monitoring a process. Consequently, they consider other monitoring techniques as alternatives to a process behavior chart. One of these proposed alternatives is an exponentially weighted moving average (EWMA). While an EWMA may be used to monitor a process and to make adjustments to the process aim, it is, at best, a poor echo of a process behavior chart.
|
ADVERTISEMENT |
Our example
The data in Figure 1 are the maximum measured diameters for a given camshaft bearing surface on 50 consecutively produced parts. The unit of measurement is 0.0001 in., and each value is the amount by which the diameter exceeds a reference value of 1.3700 in. The time order for these values is given by reading down each column, beginning with the column on the left.

Figure 1: Camshaft-bearing diameters, X
The average moving range for these camshaft-bearing diameter data is 2.04 units, which results in a value for Sigma(X) of 1.81 units. The midpoint of the specification for these diameters is 50.0 units. If this target value of 50.0 is taken as the central line for the process behavior chart, then the chart for individual values will detect deviations from target and will have limits of:
![]()
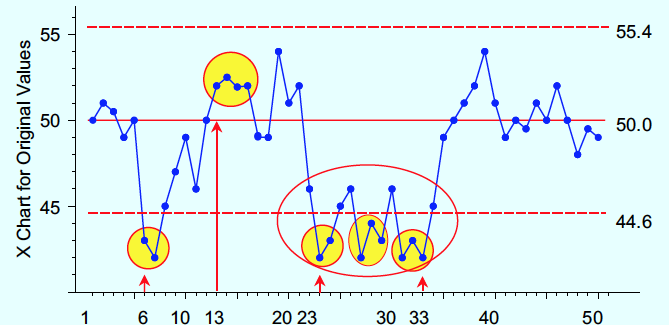
Figure 2: X-chart for bearing diameters centered on target of 50
The X chart in Figure 2 shows three periods of off-target operation. The first deviation from the target consists of parts 6, 7, and possibly 8. The second deviation from target consists of four successive parts (13 through 16) that are more than one sigma above the target. And the third deviation is signaled by 8 points below the lower limit between part 23 and part 33. Including the adjacent points in this run, parts 22 to 34 appear to have been produced while the process was not centered on the target value. Thus, these data reveal a process that is being operated in a disorganized manner. The question considered here is how well an EWMA will do in detecting these process changes.
What is an EWMA?
An EWMA creates a model from the original data. With appropriate limits to filter out the routine variation, this EWMA model can be used to detect sustained periods of off-target operation.
We start with our sequence of original data:
![]()
The starting value of the EWMA model will be the average of the first few original data. Here we will use the first five values:
![]()
Combining this first EWMA value with the original data for time period 1, and using a weight w where 0<w<1, the EWMA value for time period 2 will be:
![]()
Continuing in this manner, the EWMA value at time period [t + 1] will be:
![]()
A little algebra will turn the recursive relations above into the following:

Here we see that an EWMA contains all of the data to date, and that these data have an exponentially declining weight as they “age.” Clearly the weight, w, which is chosen by the user, will determine the properties of the EWMA. For example, the average age of the original data in an EWMA value will be given by the inverse of the weight used. That is, if w = 0.2, then the average age of the data in the weighted average will be five time periods.
To use the EWMA to detect off-target operation, we will need to compute appropriate limits to filter out the noise. When the original values represent observations on a sequence of independent and identically distributed random variables having variance, V(X), then the variance of the EWMA value for time period [t + 1] will be given by the expression:

As t increases, the second term inside the brackets will shrink. Ignoring this second term, we find an upper bound for this variance to be:

And we can use this last value to compute three-sigma limits for the EWMA values as:

where Sigma(X) is the within-subgroup variation found in the usual way from our process behavior chart.
Our first EWMA for these data will use a traditional weight of w = 0.2 and the average of the first five values as our starting EWMA value. The EWMA values are shown alongside the original data in Figure 3.

Figure 3. First EWMA for bearing diameters
The appropriate three-sigma limits for these EWMA values are:

And the EWMA chart for these data is found in Figure 4.

Figure 4: EWMA chart for bearing diameters (w = 0.20)
Due to the nature of an EWMA, we cannot use run-test rules with an EWMA chart. Only points outside the limits can be interpreted as signals.
In spite of the much tighter limits, this EWMA chart only detects two periods of off-target operation. The first excursion identifies parts 8 to 14 as “below target.” So this “signal” misses the two smallest parts (parts 6 and 7) and includes two parts (parts 13 and 14) that are actually greater than the target as being part of this run below the target.
This EWMA misses the short run above the target signaled by parts 13, 14, 15, and 16 on the process behavior chart.
The second excursion found by the EWMA identifies parts 25 to 39 as “below target.” Once again, parts 22, 23, and 24 are missed, and parts 35 to 39 are included even though four of these parts are above the target value.
So the EWMA missed one excursion and was slow to detect the other two. The reason for this is the lag that’s built into the EWMA. With an average age of five parts, this EWMA will always lag behind the original time series. It can do no other. So while it will eventually identify a sustained shift, it will tend to miss isolated, momentary, and sudden process upsets that are easily seen on a process behavior chart.
A second EWMA
“Can we fix this lag by using a different weight?”
If we use a weight of 0.8, the average age of original data represented by the EWMA will drop to 1.25 time periods. Starting with the same initial value of 50.10, this EWMA model is shown in Figures 5 and 6.

Figure 5: EWMA with weight of 0.8

Figure 6: EWMA chart with weight of 0.8
Once again, the EWMA finds two of the three excursions detected in Figure 2. Here, the excursion that started with part 6 is detected starting with part 7, while the excursion starting with part 23 is detected starting with part 24. Thus, by using a large weight, we created a model that only lags behind the original data by about one time period! This is a lot of work to approximate what the process behavior chart already gives you with so little effort.
Discussion
EWMA values are not forecasting the time series, but are actually tracking the geometric average of the time series. As an average of what has been, an EWMA cannot predict the unpredictable. It can only react to changes that have already occurred. And with its built-in lag, it will always react slowly. So while at first sight Figure 2 and Figure 4 might seem to be doing something similar, an EWMA is not an alternative to a process behavior chart. Never has been. Never will be.
EWMAs replace the original data with a model that tracks the average. EWMAs are more complex to use and harder to interpret than a process behavior chart. And EWMAs have a different objective than a process behavior chart.
So what is the purpose of an EWMA? An EWMA is the first part of a PID controller. When an EWMA is used with the limits as a dead-band to prevent over-adjustment, it can help maintain a process average near some set point. And it is algorithmic, making it ideal for automatic process control applications. So if maintaining the status quo is your objective, the EWMA may help you do that. Automatic process controllers have proven so effective at maintaining the status quo that they are everywhere around us. (For more on what automatic process controllers can and cannot do, see the references at the end of this article.)
However, a “control chart” is not a manual technique for maintaining the status quo. It was created to provide a way to improve the process for the future. This point has escaped the notice of the editors and contributors to technical journals where SPC is routinely called a “statistical process monitor.” With this characterization, they erect a barrier to using a process behavior chart for process improvement.
So, rather than seeking to maintain the status quo, you need to learn how to use a process behavior chart to improve future operation. A process behavior chart will let you identify when an assignable cause has changed your process so you can identify it, make it a controlled input, and thereby actually reduce the process variation. Since the whole point of a process behavior chart is process improvement, it will always be a serious mistake to try to replace a process behavior chart with a technique for maintaining the status quo.
References
“Can We Adjust Our Way to Quality? Part 1,” Quality Digest, Oct. 2, 2023, or spcpress.com/pdf/DJW418.pdf
“Can We Adjust Our Way to Quality? Part 2,” Quality Digest, Oct. 30, 2023, or spcpress.com/pdf/DJW419.pdf
Donald J. Wheeler’s complete “Understanding SPC” seminar may be streamed for free; for details, see spcpress.com.
Add new comment