{domain:"www.qualitydigest.com",server:"169.47.211.87"} Skip to main content

User account menu
Main navigation
  • Topics
    • Customer Care
    • FDA Compliance
    • Healthcare
    • Innovation
    • Lean
    • Management
    • Metrology
    • Operations
    • Risk Management
    • Six Sigma
    • Standards
    • Statistics
    • Supply Chain
    • Sustainability
    • Training
  • Videos/Webinars
    • All videos
    • Product Demos
    • Webinars
  • Advertise
    • Advertise
    • Submit B2B Press Release
    • Write for us
  • Metrology Hub
  • Training
  • Subscribe
  • Log in
Mobile Menu
  • Home
  • Topics
    • 3D Metrology-CMSC
    • Customer Care
    • FDA Compliance
    • Healthcare
    • Innovation
    • Lean
    • Management
    • Metrology
    • Operations
    • Risk Management
    • Six Sigma
    • Standards
    • Statistics
    • Supply Chain
    • Sustainability
    • Training
  • Login / Subscribe
  • More...
    • All Features
    • All News
    • All Videos
    • Contact
    • Training

Process Capability Confusion Caused by Skewed Distributions

Doing the math right but getting the answer wrong

John Flaig
Jack Ren
Wed, 05/31/2017 - 12:03
  • Comment
  • RSS

Social Sharing block

  • Print
Body

In a similar vein to Donald Wheeler’s excellent article on process capability confusion I would like to submit the following example of thinking that you are doing the math right and getting an answer that can get you into real trouble.

ADVERTISEMENT

Consider the following capability assessment problem. The process is stable based on the control chart, the observations are approximately normally distributed, and the mean is roughly in the middle of the tolerance. Everything conforms to the assumptions required for validating the use of the traditional process capability formula for the indices Cp and Cpk. Hence the practitioner should feel pretty good about the validity of their process capability estimates (see figure 1).


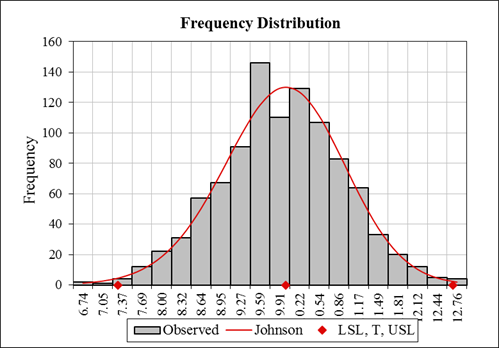
Figure 1: An approximately normal distribution

 …

Want to continue?
Log in or create a FREE account.
Enter your username or email address
Enter the password that accompanies your username.
By logging in you agree to receive communication from Quality Digest. Privacy Policy.
Create a FREE account
Forgot My Password

Comments

Submitted by Dr Burns on Thu, 06/01/2017 - 15:03

Look for causes

Rather than pulling a graph out of thin air and claiming special (read - expensive) computations are required "just in case", first ask what is the process and why is it skewed.  For example, time based processes, such as response rate in a call centre, commonly show such a distribution.  The reason data is skewed is because there is a physical limit on how fast reaction times can be.  There is little chance of people "accidentally" becoming Superman.It is no accident that Dr Wheeler usually quotes real life examples in his many brilliant papers.

  • Reply

Add new comment

Image CAPTCHA
Enter the characters shown in the image.
Please login to comment.
      

© 2025 Quality Digest. Copyright on content held by Quality Digest or by individual authors. Contact Quality Digest for reprint information.
“Quality Digest" is a trademark owned by Quality Circle Institute Inc.

footer
  • Home
  • Print QD: 1995-2008
  • Print QD: 2008-2009
  • Videos
  • Privacy Policy
  • Write for us
footer second menu
  • Subscribe to Quality Digest
  • About Us
  • Contact Us