Social Sharing block
Six Sigma is a quality improvement method that businesses have used for decades—because it gets results. A Six Sigma project follows a clearly defined series of steps, and companies in every industry in every country around the world have used this method to resolve problems. Along the way, they’ve saved billions of dollars.
|
ADVERTISEMENT |
But Six Sigma relies heavily on statistics and data analysis, and many people new to quality improvement feel intimidated by the statistical aspects.
You needn’t be intimidated. Although it’s true that data analysis is critical in improving quality, the majority of analyses in Six Sigma are not hard to understand, even if you’re not very knowledgeable about statistics.
Familiarizing yourself with these tools is a great place to start. This column briefly explains five statistical tools used in Six Sigma, what they do, and why they’re important.
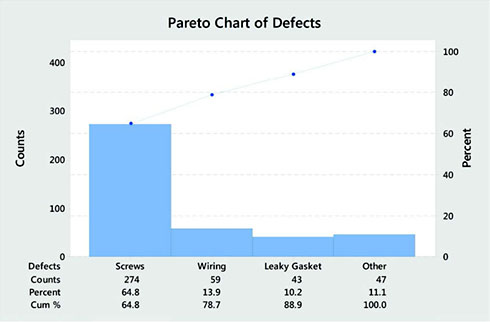
1. Pareto chart
…
Comments
Good wrap-up on these tools
This was a good summary of these tools, but in my humble opinion, you left out a very important one: The process control chart, AKA process behavior chart. Without that, you cannot know whether your Pareto chart is any good (what if the largest bar is that large because of a special cause--especially if it's one that's already been addressed). The histogram has little meaning if the data were not homogeneous; if it's a histogram of a time-ordered process, you need to find out whether that process was stable. If it's trending over time or if the process has shifted, the histogram will not be representative. Control charts should be used to baseline the process data, to check the results of pilots, to detect differences after improvements are made; they can also be used with process data in place of one-way ANOVA or t-tests, to find differences between production lines/processes or before-after testing. Unfortunately, a lot of the Six Sigma literature now relegates control charts to the CONTROL phase, and they are treated as an afterthought, when they should be the basis of any good project. I've seen Six Sigma textbooks that would have us running capability studies without running process behavior charts first.
Add new comment