{domain:"www.qualitydigest.com",server:"169.47.211.87"} Skip to main content

User account menu
Main navigation
  • Topics
    • Customer Care
    • FDA Compliance
    • Healthcare
    • Innovation
    • Lean
    • Management
    • Metrology
    • Operations
    • Risk Management
    • Six Sigma
    • Standards
    • Statistics
    • Supply Chain
    • Sustainability
    • Training
  • Videos/Webinars
    • All videos
    • Product Demos
    • Webinars
  • Advertise
    • Advertise
    • Submit B2B Press Release
    • Write for us
  • Metrology Hub
  • Training
  • Subscribe
  • Log in
Mobile Menu
  • Home
  • Topics
    • 3D Metrology-CMSC
    • Customer Care
    • FDA Compliance
    • Healthcare
    • Innovation
    • Lean
    • Management
    • Metrology
    • Operations
    • Risk Management
    • Six Sigma
    • Standards
    • Statistics
    • Supply Chain
    • Sustainability
    • Training
  • Login / Subscribe
  • More...
    • All Features
    • All News
    • All Videos
    • Contact
    • Training

What’s the Cure?

Pick a chart, any chart

Steve Wise
Tue, 09/19/2006 - 22:00
  • Comment
  • RSS

Social Sharing block

  • Print
Body

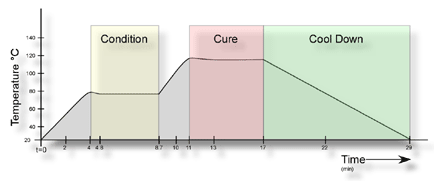
In a certain operation, a part is subject to a high-temperature curing cycle. The ideal curing scan is illustrated in the chart below. The oven chamber begins at room temperature, ramps up to a conditioning temperature of about 80 degrees, dwells for four minutes, ramps up again to the curing temperature of 120 degrees, dwells for five minutes and then cools back to room temperature.To monitor the temperature profile, a thermocouple is placed on the part. There are 11 key temperature readings during the cycle marked on the illustration. There are temperature specifications for each of the key time intervals. The software that controls the oven will generate a hard-copy scan of each curing cycle, but the company wants to use statistical process control (SPC) methods to analyze the 11 key temperature points.

What chart(s) would you recommend in this case?

Choose one of the following:

 …

Want to continue?
Log in or create a FREE account.
Enter your username or email address
Enter the password that accompanies your username.
By logging in you agree to receive communication from Quality Digest. Privacy Policy.
Create a FREE account
Forgot My Password

Add new comment

Image CAPTCHA
Enter the characters shown in the image.
Please login to comment.
      

© 2025 Quality Digest. Copyright on content held by Quality Digest or by individual authors. Contact Quality Digest for reprint information.
“Quality Digest" is a trademark owned by Quality Circle Institute Inc.

footer
  • Home
  • Print QD: 1995-2008
  • Print QD: 2008-2009
  • Videos
  • Privacy Policy
  • Write for us
footer second menu
  • Subscribe to Quality Digest
  • About Us
  • Contact Us