{domain:"www.qualitydigest.com",server:"169.47.211.87"} Skip to main content

User account menu
Main navigation
  • Topics
    • Customer Care
    • FDA Compliance
    • Healthcare
    • Innovation
    • Lean
    • Management
    • Metrology
    • Operations
    • Risk Management
    • Six Sigma
    • Standards
    • Statistics
    • Supply Chain
    • Sustainability
    • Training
  • Videos/Webinars
    • All videos
    • Product Demos
    • Webinars
  • Advertise
    • Advertise
    • Submit B2B Press Release
    • Write for us
  • Metrology Hub
  • Training
  • Subscribe
  • Log in
Mobile Menu
  • Home
  • Topics
    • 3D Metrology-CMSC
    • Customer Care
    • FDA Compliance
    • Healthcare
    • Innovation
    • Lean
    • Management
    • Metrology
    • Operations
    • Risk Management
    • Six Sigma
    • Standards
    • Statistics
    • Supply Chain
    • Sustainability
    • Training
  • Login / Subscribe
  • More...
    • All Features
    • All News
    • All Videos
    • Contact
    • Training

What Makes Great Presidents and Good Models?

It depends on predictors, correlation—oh, and your opinion

Patrick Runkel
Mon, 03/04/2013 - 10:39
  • Comment
  • RSS

Social Sharing block

  • Print
  • Add new comment
Body

ADVERTISEMENT

If the title of this post made you think you’d be reading about Abraham Lincoln and Tyra Banks, you’re only half right.

ADVERTISEMENT

A few weeks ago, statistician and journalist Nate Silver published an interesting post on how U.S. presidents are ranked by historians. Silver showed that the percentage of electoral votes that a U.S. president receives during his second-term election serves as a rough predictor of his average ranking of greatness.

Here’s the model he came up with (in figure 1), which I’ve duplicated in Minitab using the scatterplot with regression and groups (Graph > Scatterplot).

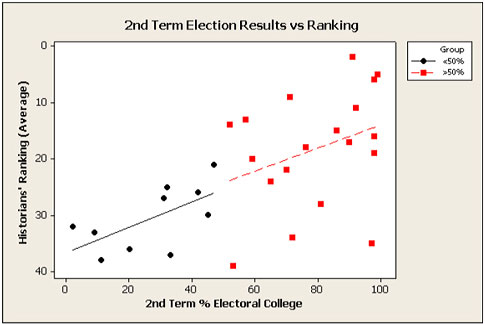
Figure 1: Model for percentage of second-term electoral votes for U.S. presidents

 …

Want to continue?
Log in or create a FREE account.
Enter your username or email address
Enter the password that accompanies your username.
By logging in you agree to receive communication from Quality Digest. Privacy Policy.
Create a FREE account
Forgot My Password

Comments

Submitted by umberto mario tunesi on Thu, 03/07/2013 - 19:51

Sanskrit-istics

My own opinion: in more than 40 years work experience I've been fortunate enough to meet ONE - just one - Statistician who speaks of Life events. All others, starting with Mr. Laplace and his ascendants, are obsessed with gambling figures. The Gallup's methodology is surely a great step forward in predicting outputs: but how is it that the officlal prediction of Italy's election outcome is based on surveying a 650 inhabitants nowhere village located between the Tirrenian Sea and the Alps? Italy's potential electors are 10 to the 5th as much. Let's therefore be more careful with charts, please, let's not make them another bible: as they say, effective charting is between the ears, not between the hands. Thank you.

  • Reply

Add new comment

Image CAPTCHA
Enter the characters shown in the image.
Please login to comment.
      

© 2025 Quality Digest. Copyright on content held by Quality Digest or by individual authors. Contact Quality Digest for reprint information.
“Quality Digest" is a trademark owned by Quality Circle Institute Inc.

footer
  • Home
  • Print QD: 1995-2008
  • Print QD: 2008-2009
  • Videos
  • Privacy Policy
  • Write for us
footer second menu
  • Subscribe to Quality Digest
  • About Us
  • Contact Us