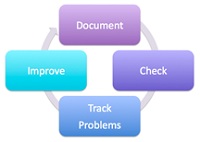
In Part I, “Savvy Compliance Strategy Can Improve GMP,” we took a high-level look at a process for automating regulatory compliance management. The closed-loop process starts with documenting your processes, followed by monitoring or checking that the processes are being followed. Next, you provide a means of tracking or logging any problems that may arise and then take actions to improve. Improvement should then result in a revision to the documented process followed by notifying or training those affected by the process improvement. This closed-loop process, which I call the “Circle of Compliance,” should be used to automate compliance with regulatory standards (see figure 1).
Now let’s take a closer look at the “check” step. This step’s objective is to eliminate the need to manually audit a process to determine its effectiveness. One way to do this is by defining a key performance indicator (KPI). That’s a performance measurement that is used to help an organization monitor progress to goals. For example, a company may decide to improve responsiveness by reducing the number of late tasks. It might also set a goal for reducing violations or incidents to improve conformance to regulations or standards. A sample dashboard showing these two KPIs is depicted in figure 2.
Let’s take a closer look at this KPI dashboard. Both measurements are listed—late projects and monthly incidents. Notice that the date the measurement was made as well as actual performance data are displayed. We can see that for the month of May there were two late projects and five incidents. Then on the right we see a trend arrow and a traffic light, which give a quick comparison of performance to goal. Green is good and red is bad. Of course, to set the traffic light to the correct state (green, yellow, or red), we need some reference points.
ADVERTISEMENT |
For example, if there is only one late project each month, the light will be green. If there are between two and four late projects, we would consider that a yellow light (or caution). And if there were more than four late projects in a given month, we would set the light to red.
When implemented properly, KPIs monitor performance during a given time period (e.g., day, week, month) and provide a visual indication (such as a traffic light) of performance to goal. Let’s dig a bit deeper to better understand how to do it right.
Because KPIs measures performance during a given time period, historical data, trends, and state changes must be present. Details of each of these elements can be reviewed. By clicking on the KPI dashboard, we can see past measurements (shown in figure 3).
We can see from the historical data that the trend is moving from bad to good, and that in May there was a state change from red to yellow. This system is set up to automatically send an e-mail to the KPI owner whenever there is a state change (see figure 4).
If you look back at the KPI dashboard, you see the trend arrow is green and pointing down. This direction indicates we have fewer late projects than during the previous reporting period. The arrow is green, which indicates this is a desirable trend.
In summary, setting up KPIs that monitor your performance to goals is a good way to check that your processes are working properly. It also eliminates the need to perform manual audits of a given operation, which helps reduce labor costs. The next step in this closed-loop process is tracking problems, which we’ll look at in part three of this series.
Comments
Part III is now available
I you liked Part I and Part II, Part III is now up online. You can read it here: http://bit.ly/axZjqs
Add new comment