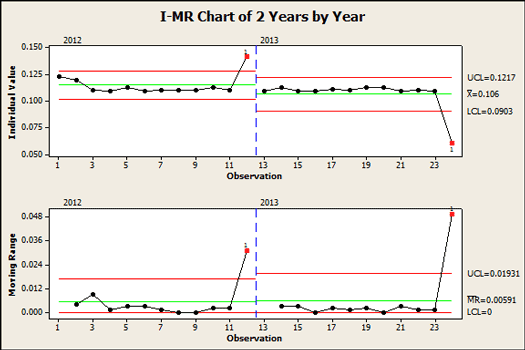
This I-MR chart displays the data in two distinct phases by year
Credit: Minitab
Social Sharing block
A member of Minitab’s LinkedIn group asked how to create a chart to monitor change by month, specifically comparing last year’s data to this year’s data. My last post showed how to do this using an Individuals chart of the differences between this year’s and last year’s data. Here’s another approach suggested by a participant in the group.
|
ADVERTISEMENT |
Applying statistical thinking
An Individuals chart of the differences between this year’s data and last year’s might not be our best approach. Another approach is to look at all of the data together. We’ll put this year’s and last year’s data into a single column and see how it looks in an individuals chart. (Want to play along? Here’s my data set.)
…
Add new comment