{domain:"www.qualitydigest.com",server:"169.47.211.87"} Skip to main content

        
User account menu
Main navigation
  • Topics
    • Customer Care
    • Regulated Industries
    • Research & Tech
    • Quality Improvement Tools
    • People Management
    • Metrology
    • Manufacturing
    • Roadshow
    • QMS & Standards
    • Statistical Methods
    • Resource Management
  • Videos/Webinars
    • All videos
    • Product Demos
    • Webinars
  • Advertise
    • Advertise
    • Submit B2B Press Release
    • Write for us
  • Metrology Hub
  • Training
  • Subscribe
  • Log in
Mobile Menu
  • Home
  • Topics
    • Customer Care
    • Regulated Industries
    • Research & Tech
    • Quality Improvement Tools
    • People Management
    • Metrology
    • Manufacturing
    • Roadshow
    • QMS & Standards
    • Statistical Methods
    • Supply Chain
    • Resource Management
  • Login / Subscribe
  • More...
    • All Features
    • All News
    • All Videos
    • Training

TrueGage Releases TrueMap 6 Software for Surface Metrology Visualization and Analysis

New features include redesigned user interface and multi-threaded algorithms to improve performance

Wed, 04/27/2022 - 12:00
  • Comment
  • RSS

Social Sharing block

  • Print
Body

(TrueGage: Jeannette, PA) -- TrueGage announced the release of TrueMap 6, a major new version of the company’s software platform for surface imaging and analysis.

ADVERTISEMENT

With version 6 comes a fully redesigned version of TrueMap software. This latest version of the software is fully 64-bit and contains multi-threaded algorithms to greatly improve performance, a redesigned user interface, and a long list of new capabilities.


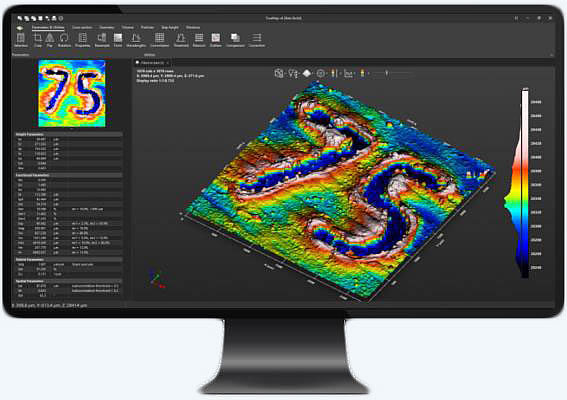
TrueMap 6: Surface texture visualization and analysis software

Users of 2D and 3D contact and noncontact profilometers, white light interferometers, confocal microscopes, and laser triangulation sensors, working in a wide range of application fields, will discover a wealth of new capabilities for their image and surface analysis. These new surface data visualization tools make it easier to extract meaning from the collected data.

 …

Want to continue?
Log in or create a FREE account.
Enter your username or email address
Enter the password that accompanies your username.
By logging in you agree to receive communication from Quality Digest. Privacy Policy.
Create a FREE account
Forgot My Password
You Might Like...
What's a 150-year Old Meat Chopper Have to do With America's Favorite Muscle Car?
Implementing Manufacturing Training Programs in 2026
How DIY AI Unlocks Productivity and Flexibility
Otis Expands Little Engineers STEM Program Globally
Which KPIs Prove Your Maintenance Plan Is Working?

Add new comment

Image CAPTCHA
Enter the characters shown in the image.
Please login to comment.

© 2026 Quality Digest. Copyright on content held by Quality Digest or by individual authors. Contact Quality Digest for reprint information.
“Quality Digest" is a trademark owned by Quality Circle Institute Inc.

footer
  • Home
  • Print QD: 1995-2008
  • Print QD: 2008-2009
  • Videos
  • Privacy Policy
  • Write for us
footer second menu
  • Subscribe to Quality Digest
  • About Us