{domain:"www.qualitydigest.com",server:"169.47.211.87"} Skip to main content

User account menu
Main navigation
  • Topics
    • Customer Care
    • FDA Compliance
    • Healthcare
    • Innovation
    • Lean
    • Management
    • Metrology
    • Operations
    • Risk Management
    • Six Sigma
    • Standards
    • Statistics
    • Supply Chain
    • Sustainability
    • Training
  • Videos/Webinars
    • All videos
    • Product Demos
    • Webinars
  • Advertise
    • Advertise
    • Submit B2B Press Release
    • Write for us
  • Metrology Hub
  • Training
  • Subscribe
  • Log in
Mobile Menu
  • Home
  • Topics
    • 3D Metrology-CMSC
    • Customer Care
    • FDA Compliance
    • Healthcare
    • Innovation
    • Lean
    • Management
    • Metrology
    • Operations
    • Risk Management
    • Six Sigma
    • Standards
    • Statistics
    • Supply Chain
    • Sustainability
    • Training
  • Login / Subscribe
  • More...
    • All Features
    • All News
    • All Videos
    • Contact
    • Training

Kurtosis Visualized

No one really understands kurtosis. Here’s why.

"Skew-whiff" Credit: Bahi

Donald J. Wheeler
Mon, 02/06/2023 - 12:03
  • Comment
  • RSS

Social Sharing block

  • Print
  • Add new comment
Body

The shape parameters for a probability model are called skewness and kurtosis. While skewness at least sounds like something we might understand, kurtosis simply sounds like jargon. Here we’ll use some examples to visualize just what happens to a probability model as kurtosis increases. Then we’ll combine the visible effects of both skewness and kurtosis to see how they combine to “shape” probability models

ADVERTISEMENT

Last month, we found that while an increase in positive skewness measures a nearly invisible increase in the area of the upper tail, it has two visible manifestations. Specifically, these are a substantially shorter lower tail and an appreciable shift of the mode to the left. Figure 1 summarizes these results for the three comparisons made.


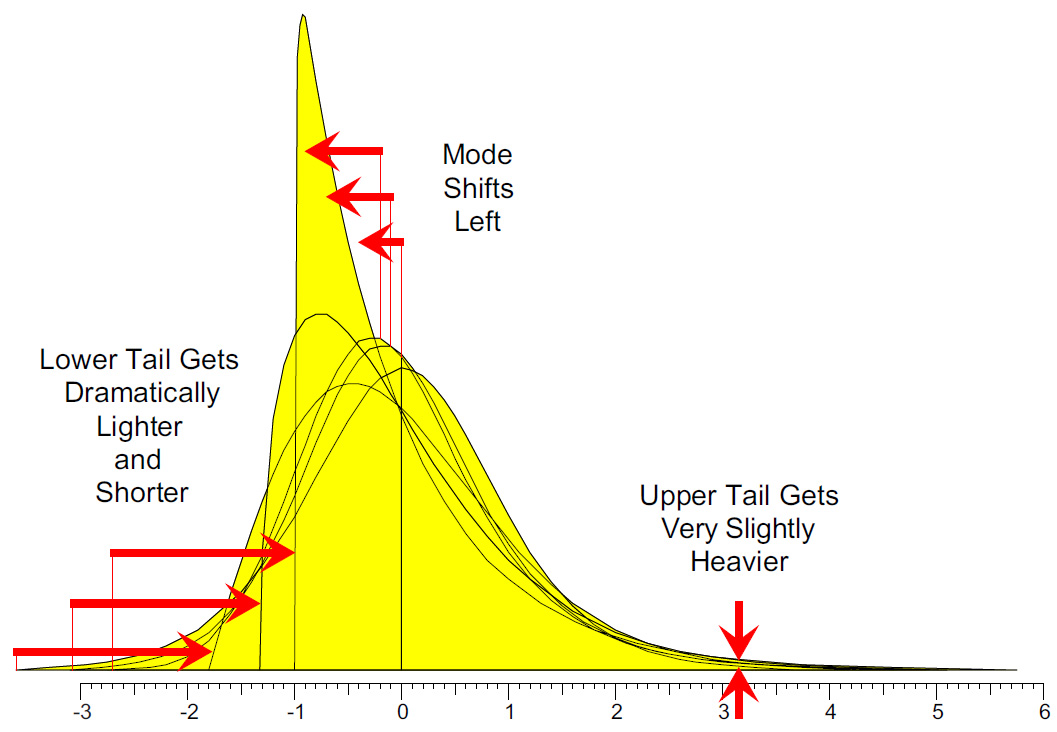
Figure 1: Effects of increasing positive skewness while holding kurtosis constant

Figure 1 shows what happens when we hold the kurtosis constant and increase the skewness. In the comparisons that follow, we’ll look at what happens when we increase the kurtosis while holding the skewness constant.

 …

Want to continue?
Log in or create a FREE account.
Enter your username or email address
Enter the password that accompanies your username.
By logging in you agree to receive communication from Quality Digest. Privacy Policy.
Create a FREE account
Forgot My Password

Comments

Submitted by Steve65 on Wed, 02/08/2023 - 06:00

Excellent

I love how Dr. Wheeler explains the mathematical details for those who care about such things, but boils it all down to what 99.9% of all practitioners need to know in a just few key sentences using simple language at the end. 

Dr. Wheeler is a treasure as he is one of the few who tries to simplify things instead of complicate them unnecessarily. 

  • Reply

Add new comment

Image CAPTCHA
Enter the characters shown in the image.
Please login to comment.
      

© 2025 Quality Digest. Copyright on content held by Quality Digest or by individual authors. Contact Quality Digest for reprint information.
“Quality Digest" is a trademark owned by Quality Circle Institute Inc.

footer
  • Home
  • Print QD: 1995-2008
  • Print QD: 2008-2009
  • Videos
  • Privacy Policy
  • Write for us
footer second menu
  • Subscribe to Quality Digest
  • About Us
  • Contact Us