{domain:"www.qualitydigest.com",server:"169.47.211.87"} Skip to main content

User account menu
Main navigation
  • Topics
    • Customer Care
    • FDA Compliance
    • Healthcare
    • Innovation
    • Lean
    • Management
    • Metrology
    • Operations
    • Risk Management
    • Six Sigma
    • Standards
    • Statistics
    • Supply Chain
    • Sustainability
    • Training
  • Videos/Webinars
    • All videos
    • Product Demos
    • Webinars
  • Advertise
    • Advertise
    • Submit B2B Press Release
    • Write for us
  • Metrology Hub
  • Training
  • Subscribe
  • Log in
Mobile Menu
  • Home
  • Topics
    • 3D Metrology-CMSC
    • Customer Care
    • FDA Compliance
    • Healthcare
    • Innovation
    • Lean
    • Management
    • Metrology
    • Operations
    • Risk Management
    • Six Sigma
    • Standards
    • Statistics
    • Supply Chain
    • Sustainability
    • Training
  • Login / Subscribe
  • More...
    • All Features
    • All News
    • All Videos
    • Contact
    • Training

Right Chart or Right Action?

No extra credit for choosing the technically correct chart

Davis Balestracci
Wed, 06/11/2014 - 14:52
  • Comment
  • RSS

Social Sharing block

  • Print
  • Add new comment
Body

Do you still insist on asking, “Which chart do I use for which situation?”

ADVERTISEMENT

I’ve seen many flowcharts in books to help you answer this question. They’re all some variation of this:

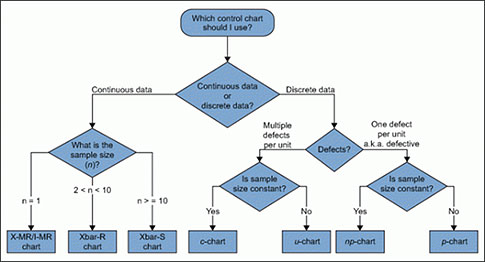
I find them far too confusing for the average user and have never taught this in my work. Besides, you get no credit for choosing the technically correct chart or computing the right numbers—only for taking the right action.

Your ‘Swiss Army knife’

For any initial chart for process assessment, the data should be in its naturally occurring time sequence, preferably as a run chart. Next, the control chart of choice with which to start is virtually almost always the I-chart (individuals chart), which uses the moving range (MR) between consecutive points to determine its common-cause limits. The I-chart is the “Swiss Army knife” of control charts. As I have discovered time and time again, it usually approximates the “correct” chart under most conditions, and its use is easier to explain.

I can hear the chorus: “So, what are the conditions when it isn’t correct?”

 …

Want to continue?
Log in or create a FREE account.
Enter your username or email address
Enter the password that accompanies your username.
By logging in you agree to receive communication from Quality Digest. Privacy Policy.
Create a FREE account
Forgot My Password

Comments

Submitted by Steve Moore on Wed, 06/11/2014 - 09:56

I-MR Chart

In utilizing Process Behavior Charts for over 35 years, I have found that the I-MR Chart (almost) never fails to give the insight needed. In my in-house training sessions, I mention the others (C Chart, P Chart, etc.) but stopped trying to teach them several years ago.
  • Reply

Submitted by kkbari on Fri, 06/13/2014 - 10:23

In reply to I-MR Chart by Steve Moore

Teaching charts

Ditto - I teach from a pre-done class and I make about a 1 minute comment about the rest that if the IMR chart doesn't work, there are other options.  I agree with Davis' comment about generalization and would extrapolate to just about any industry outside of manufacturing, the sample size is 1.

  • Reply

Submitted by rderoeck on Thu, 06/12/2014 - 08:37

Verifying Assumptions for Attribute charts

The notion that a typical user of control charts is able to verify the theoretical assumptions that Wheeler writes about in his books on charts for counts is just not realistic. With the XmR chart, you can skip all that since the limits are empirical. This allows you to get to work on the process right away.

Rich  

  • Reply

Submitted by knowwareman on Fri, 06/13/2014 - 09:48

Software or Brainware?

Most SPC software asks you to figure out which control chart to use before you select data.

This means that you have to mentally walk through a forest of decision trees to get a chart. You have to use your noggin--your brainware. For the expert this is easy; for the novice or occasional user this can be difficult.

The QI Macros for Excel asks you to select the data first. That way the Control Chart Wizard can analyze your data, run through the decision trees for you and choose the right chart.

So, do you want to keep using your brainware and worrying that you've made the right choice?

Or would you rather let your software help you get the right answer?

  • Reply

Add new comment

Image CAPTCHA
Enter the characters shown in the image.
Please login to comment.
      

© 2025 Quality Digest. Copyright on content held by Quality Digest or by individual authors. Contact Quality Digest for reprint information.
“Quality Digest" is a trademark owned by Quality Circle Institute Inc.

footer
  • Home
  • Print QD: 1995-2008
  • Print QD: 2008-2009
  • Videos
  • Privacy Policy
  • Write for us
footer second menu
  • Subscribe to Quality Digest
  • About Us
  • Contact Us