{domain:"www.qualitydigest.com",server:"169.47.211.87"} Skip to main content

User account menu
Main navigation
  • Topics
    • Customer Care
    • FDA Compliance
    • Healthcare
    • Innovation
    • Lean
    • Management
    • Metrology
    • Operations
    • Risk Management
    • Six Sigma
    • Standards
    • Statistics
    • Supply Chain
    • Sustainability
    • Training
  • Videos/Webinars
    • All videos
    • Product Demos
    • Webinars
  • Advertise
    • Advertise
    • Submit B2B Press Release
    • Write for us
  • Metrology Hub
  • Training
  • Subscribe
  • Log in
Mobile Menu
  • Home
  • Topics
    • 3D Metrology-CMSC
    • Customer Care
    • FDA Compliance
    • Healthcare
    • Innovation
    • Lean
    • Management
    • Metrology
    • Operations
    • Risk Management
    • Six Sigma
    • Standards
    • Statistics
    • Supply Chain
    • Sustainability
    • Training
  • Login / Subscribe
  • More...
    • All Features
    • All News
    • All Videos
    • Contact
    • Training

How a Poor Memory Helps to Model Failure Data

The forgetful (and helpful) characteristic of exponential distribution

Patrick Runkel
Tue, 06/03/2014 - 13:45
  • Comment
  • RSS

Social Sharing block

  • Print
  • Add new comment
Body

These days, my memory isn’t what it used to be. Besides that, my memory isn’t what it used to be. But my incurable case of CRS (can’t remember stuff) is not nearly as bad as that of the exponential distribution.

ADVERTISEMENT

When modeling failure data for reliability analysis, the exponential distribution is completely memoryless. It retains no record of the previous failure of an item. That might sound like a bad thing. But this special characteristic makes the distribution extremely useful for modeling the behavior of items that have a constant failure rate.

Using the exponential distribution to model failure data

Suppose you track the time until failure of a randomly collected sample of items. When you graph the results on a histogram, you get something like this:

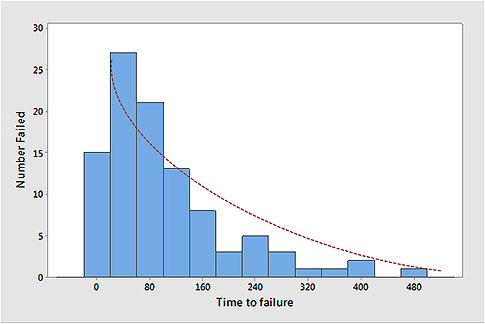
Notice that the number of items that fail at a given point in time decreases steadily as time elapses. This steady decrease can be fit nicely to an exponential curve.

 …

Want to continue?
Log in or create a FREE account.
Enter your username or email address
Enter the password that accompanies your username.
By logging in you agree to receive communication from Quality Digest. Privacy Policy.
Create a FREE account
Forgot My Password

Comments

Submitted by kkbari on Tue, 06/03/2014 - 10:58

Exponential Example

For those who struggle with the idea of a memoryless property, time between work injuries often follow this distribution.  So you sit at the morning meeting and say, "OK, what is the likelihood of having an injury today?".  Let's say it is 5%.  Then you go without injury today and come in tomorrow and say "OK, what is the likelihood of having an injury today?".  It doesn't increase because you are now pressing your luck.  It is still 5%.  And you go a week without injuries and then come in the next and ask the question.  If the environment and causes haven't changed, it is still 5%. 

  • Reply

Submitted by prunkel on Wed, 06/11/2014 - 04:29

In reply to Exponential Example by kkbari

Thanks for the great example

And, by the same token, if you do have a work injury, or injuries,  the likelihood is still 5% according to the memoryless property. It doesn't decrease because you "got your injury out of the way". Great concrete example--thanks for commenting.

  • Reply

Add new comment

Image CAPTCHA
Enter the characters shown in the image.
Please login to comment.
      

© 2025 Quality Digest. Copyright on content held by Quality Digest or by individual authors. Contact Quality Digest for reprint information.
“Quality Digest" is a trademark owned by Quality Circle Institute Inc.

footer
  • Home
  • Print QD: 1995-2008
  • Print QD: 2008-2009
  • Videos
  • Privacy Policy
  • Write for us
footer second menu
  • Subscribe to Quality Digest
  • About Us
  • Contact Us