{domain:"www.qualitydigest.com",server:"169.47.211.87"} Skip to main content

User account menu
Main navigation
  • Topics
    • Customer Care
    • FDA Compliance
    • Healthcare
    • Innovation
    • Lean
    • Management
    • Metrology
    • Operations
    • Risk Management
    • Six Sigma
    • Standards
    • Statistics
    • Supply Chain
    • Sustainability
    • Training
  • Videos/Webinars
    • All videos
    • Product Demos
    • Webinars
  • Advertise
    • Advertise
    • Submit B2B Press Release
    • Write for us
  • Metrology Hub
  • Training
  • Subscribe
  • Log in
Mobile Menu
  • Home
  • Topics
    • 3D Metrology-CMSC
    • Customer Care
    • FDA Compliance
    • Healthcare
    • Innovation
    • Lean
    • Management
    • Metrology
    • Operations
    • Risk Management
    • Six Sigma
    • Standards
    • Statistics
    • Supply Chain
    • Sustainability
    • Training
  • Login / Subscribe
  • More...
    • All Features
    • All News
    • All Videos
    • Contact
    • Training

How Do You Treat Special-Cause Signals?

By using your brain…

Davis Balestracci
Wed, 10/29/2008 - 15:35
  • Comment
  • RSS

Social Sharing block

  • Print
Body

Take a look at the control chart in figure 1. There are no observations outside the common-cause limits, but there are five special-cause flags:

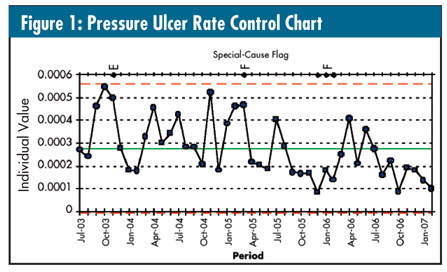
• Observation 5: Two out of three consecutive points greater than two standard deviations away from the mean

• Observations 21 and 30-32: Four out of five consecutive points greater than one standard deviation away from the mean


So, what do you do? Treat them as five individual special causes? Say, “Well, if you look at it realistically, there really seems to be three ‘clumps’ of special cause?” Because the last seven observations all fall below the mean, some readers might want to call them special causes as well. Maybe nothing should be done because no individual points are outside of the limits.

What have been your experiences?

As I’ve tried to emphasize time and again in this column, always do a run chart of your data first (as seen in figure 2).

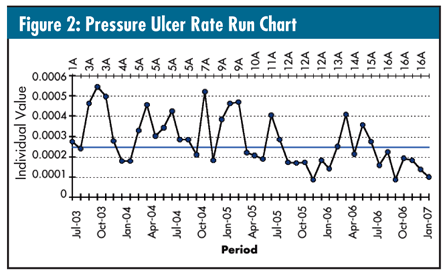
There are no trends and no runs of eight in a row either above or below the median--although there are two runs of seven in a row (No. 9-15 and No. 38-44).

 …

Want to continue?
Log in or create a FREE account.
Enter your username or email address
Enter the password that accompanies your username.
By logging in you agree to receive communication from Quality Digest. Privacy Policy.
Create a FREE account
Forgot My Password

Comments

Add new comment

Image CAPTCHA
Enter the characters shown in the image.
Please login to comment.
      

© 2025 Quality Digest. Copyright on content held by Quality Digest or by individual authors. Contact Quality Digest for reprint information.
“Quality Digest" is a trademark owned by Quality Circle Institute Inc.

footer
  • Home
  • Print QD: 1995-2008
  • Print QD: 2008-2009
  • Videos
  • Privacy Policy
  • Write for us
footer second menu
  • Subscribe to Quality Digest
  • About Us
  • Contact Us