{domain:"www.qualitydigest.com",server:"169.47.211.87"} Skip to main content

User account menu
Main navigation
  • Topics
    • Customer Care
    • FDA Compliance
    • Healthcare
    • Innovation
    • Lean
    • Management
    • Metrology
    • Operations
    • Risk Management
    • Six Sigma
    • Standards
    • Statistics
    • Supply Chain
    • Sustainability
    • Training
  • Videos/Webinars
    • All videos
    • Product Demos
    • Webinars
  • Advertise
    • Advertise
    • Submit B2B Press Release
    • Write for us
  • Metrology Hub
  • Training
  • Subscribe
  • Log in
Mobile Menu
  • Home
  • Topics
    • 3D Metrology-CMSC
    • Customer Care
    • FDA Compliance
    • Healthcare
    • Innovation
    • Lean
    • Management
    • Metrology
    • Operations
    • Risk Management
    • Six Sigma
    • Standards
    • Statistics
    • Supply Chain
    • Sustainability
    • Training
  • Login / Subscribe
  • More...
    • All Features
    • All News
    • All Videos
    • Contact
    • Training

Novel Uses of the Pareto Chart Through Human History

All of this has happened before, and all of this will happen again

Patrick Runkel
Wed, 05/25/2016 - 16:45
  • Comment
  • RSS

Social Sharing block

  • Print
Body

The Pareto chart is a graphic representation of the 80/20 rule, also known as the Pareto principle. If you’re a quality improvement specialist, you know that the chart is named after the early 20th-century economist Vilfredo Pareto, who discovered that roughly 20 percent of the population in Italy owned about 80 percent of the property at that time.

ADVERTISEMENT

You probably also know that the Pareto principle was later adopted and repurposed as a powerful business metric by Joseph Juran during the 1940s, to identify the “vital few” issues vs. the “trivial many.”

But most people don’t realize that human use of the Pareto chart goes back much earlier than this. Archaeological evidence suggests the chart could date back to the Middle Paleolithic era: using broken-off mastodon bones for bars, and hyena sinews for connect lines, it appears Stone Age humans constructed rudimentary Pareto charts to depict problems as they first began to cook with fire.

Based on the fossilized records, I used Minitab statistical software to recreate a Stone Age Pareto chart:
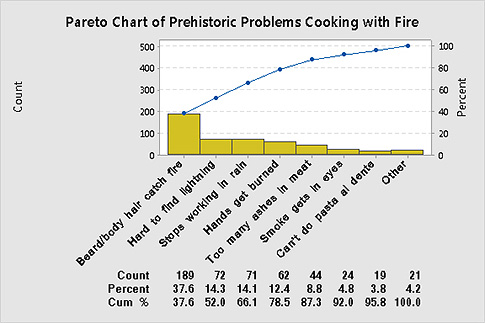
 …

Want to continue?
Log in or create a FREE account.
Enter your username or email address
Enter the password that accompanies your username.
By logging in you agree to receive communication from Quality Digest. Privacy Policy.
Create a FREE account
Forgot My Password

Add new comment

Image CAPTCHA
Enter the characters shown in the image.
Please login to comment.
      

© 2025 Quality Digest. Copyright on content held by Quality Digest or by individual authors. Contact Quality Digest for reprint information.
“Quality Digest" is a trademark owned by Quality Circle Institute Inc.

footer
  • Home
  • Print QD: 1995-2008
  • Print QD: 2008-2009
  • Videos
  • Privacy Policy
  • Write for us
footer second menu
  • Subscribe to Quality Digest
  • About Us
  • Contact Us