Social Sharing block
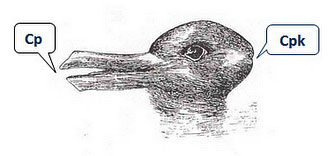
It’s usually not a good idea to rely solely on a single statistic to draw conclusions about your process. Do that, and you could fall into the clutches of the “duck-rabbit” illusion shown below.
If you fix your eyes solely on the duck, you’ll miss the rabbit—and vice-versa.
|
ADVERTISEMENT |
If you’re using Minitab Statistical Software for capability analysis, the capability indices Cp and Cpk are good examples of this. If you focus on only one measure, and ignore the other, you might miss seeing something critical about the performance of your process.
Cp: A tale of two tails
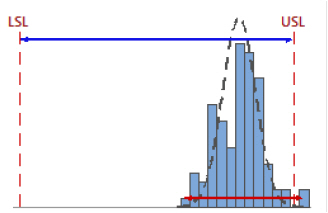
Cp is a ratio of the specification spread to the process spread. The process spread is often defined as the six sigma spread of the process (that is, six times the within-subgroup standard deviation). Higher Cp values indicate a more capable process.
When the specification spread is considerably greater than the process spread, Cp is high.
…
Comments
Good Job
We've been showing the limitations of Cp, Cpk in our seminars for years using very similar graphics to what you have shown. It's always eye opening for students to really understand what these indices fail to tell you. Nice summary of the key differences and limitations. I might also stress that far too often the indices are computed assuming the data is well described by a normal distribution and also assuming the process is stable. Often these are not the case. When normality is violated the shape of the data must be accounted for (various methods) and no capability assessment is meaningful for an unstable process.
What is the target?
Cp and Cpk dont tell us everything either. What is the data spread as related to the target? Process X's and Y's data spread might be centered around the target or not even close. How would we know? And we should also considered the impact of step functions. Do we really want a process that has a tight distribution inside the step function called a spec limit, but just inside the limit? Certainly there is risk there. There may be siginifcant loss in fit or funtion of whatever process Y is producing, assuming the data is not centered on the target. Consideration of the Taguchi Loss Function might expose futher problems represented in these data sets.
Cpm
DVANPUTTEN,
Cpm solves the issue around how close the process is to the target. The calculation is similar to the formula for standard deviation with the exception that the target is used in place of the mean of the data.
k in Cpk
It might help some folks to consider what "k" represents in Cpk. If we express Cpk as Cp times (1 - |k|) then I think about it a little differently compared to the typical expression minimum (Cpl, Cpu). It should be easy to calculate and display k (k for katayori, meaning deviation or offset). And yeah, I understand Cp needs two limits but the notion still holds.
What is the source and
What is the source and purpose of the fictitious distributions drawn over every graph?
Fictitious Distributions
Very good question! Simply put; it makes people feel good about their false beliefs. I have seen many data sets that satisfy the "goodness of fit" test for up to six different distributions! For some reason, people desire the normal distribution. Six Sigma practitioners are obsessed with the normal distribution. At a Deming 4-day seminar in 1991, I heard Dr. Deming say, "Normal distribution? I've never seen one." At the time, I thought he was crazy! Now I am older and enlightened (at least somewhat enlightened!) by Dr. Deming's teachings.
Good points
I appreciate all the astute comments here!
No doubt Cpm is another important stat to consider if you have a process target. The main point being, of course, that one should never get too fixated on any single stat but look at the data from as many angles as possible.
And yes, the normal distribution is generally overrated and people mistakenly think that if their data aren't normal, that it's "bad" or abnormal. The distribution curves for the illlustrations in this post were generated using a normal capability analysis, hence the bell curves. Certainly didn't mean to imply by using them that eveyrone should be using a normal distribution model to analyze their data!
It's true that some data sets can satsify goodness-of-fit tests for several distributions. It's important to remember, though, that those tests only detect statistically significant *departures* from the selected distribution. That is, the null hypothesis (the assumption) is that the data fit the distirbution, the alternative is that the data do not fit. So failure to reject the null only means that you do not have sufficient evidence to show that your data do NOT fit a given distribution. If the sample is small, that could simply due to a lack of sufficient power. That's why it's also critical to apply process knowledge, subject matter expertise, historical studies, and so on, when selecting a distribution model for your data, in conjunction with the results from a goodnes-of-fit test.
Statistics is a powerful tool, but only when used synergistically with many other sources of one's brain capacity!
The use of Six Sigma term in Cp and Cpk
Hi Patrick,
Agree with the article. Just a small issue I have when this Capability issue is raised and used. Control Charts were invented by Walter Shewhart as we know and he took great pains to explain the +/- 3 standard deviations or Sigma's.
Your article says early on in the piece 'six sigma'. I think we all understand that but for Six Sigma (Trade and Service mark for the then 1987 Motorola Quality Program) fraternity they seem to forget it is derived from the above Shewart calculation. Secondly, from a Process in its raw form (not having to be 'normalised') and reflected in a the Control Chart which produces a Histogram. Something I find many have not made the connection. Weird. The AIAG SPC Manual provides such guidance.
I noticed you used process capability in its rightful place and did not go into the spurious Six Sigma's +/- 1.5 Std Deviation Process Shift Allowance for Six Sigma.
That was all, thanks again.
Michael
Re: The use of Six Sigma term in Cp and Cpk
Hi Michael,
Thanks for taking the time to point out these important distinctions. It's always a good to go back to the source and reinforce the concrete meaning of these fundamental concepts in SPC. They easily get lost in the fray. I appreciate your commenting.
Patrick
Add new comment