Cost for QD employees to rent an apartment in Chico, CA. $1,200/month. Please turn off your ad blocker in Quality Digest
Our landlords thank you.
Donald J. Wheeler
Published: Tuesday, September 6, 2022 - 12:03 Many people have been taught that capability indexes only apply to “normally distributed data.” This article will consider the various components of this idea to shed some light on what has, all too often, been based on superstition. Capability and performance indexes are arithmetic functions of the data. They are no different from an average or a range, just slightly more complex. The four basic indexes are the following: The capability ratio, Cp, is an index number that compares the [space available within the specifications] with the [generic space required for any predictable process]. 
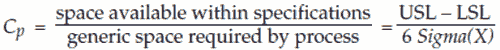
The performance ratio, Pp, is another index number that compares the [space available within specifications] with the [estimated space used by process in the past]. The centered capability and performance indexes depend upon a quantity known as the distance to nearer specification (DNS). The DNS is the minimum of [USL—Average] and [Average—LSL]. The centered capability ratio, Cpk, is an index number that uses twice the DNS to define the [effective space available within specifications] and then compares this with the [generic space required for any predictable process]. The centered performance ratio, Ppk, is an index number that compares the [effective space available within specifications] with the [generic space used in past by process]. The numerators in these four indexes are functions of the specification limits and the average statistic. As such, they make no demands regarding the shape of the histogram for the data. The denominators of these four indexes are multiples of some dispersion statistic. The performance indexes use the global standard deviation statistic, s, which is simply a direct computation from the data. Regardless of the shape of the histogram, this statistic describes the radius of gyration for the data, and as such makes no demands regarding the shape of the histogram.1 The capability indexes use the within-subgroup dispersion, Sigma(X). While this statistic may be computed several ways, it is most commonly found by dividing an average range statistic by the appropriate bias correction factor, d2. Some authors claim that using d2 imposes a requirement of normality upon the data. However, this is not true. While the values for d2 were initially computed using a normal distribution, in 1967 Irving Burr computed the d2 values for 27 non-normal distributions and discovered that they are all very similar. Burr’s results show that knowing and using an exact value for d2 has virtually no effect upon the estimate of dispersion. The variation in average range statistic dominates the variation due to the different values of d2. Thus, in practice, we may regard d2 as effectively constant regardless of the shape of the histogram.2 So the only remaining part of the capability and performance indexes left that could impose a requirement of normality is the multiplier of 6.0. Students often get the idea that six sigma coverage is specific to the normal distribution because that is all they see pictured. It turns out that a property of rotational inertia effectively prohibits any mound-shaped histogram, regardless of its shape, from ever having more than 2 percent of the data outside the interval defined by the average plus or minus three standard deviations. This is illustrated in Figure 1, which contains four digital probability models that each use 200 squares. These are not histograms, but rather are exact standardized digital probability models with means of zero and standard deviations of 1.000. Here we see that a central interval of width equal to six standard deviations will bracket approximately 99 percent of the process, regardless of the shape of the model. When the tail of a probability model gets stretched, it also gets attenuated. Consequently, the proportion of values more than three standard deviations away from the mean is strictly limited. And this is why the multiplier of 6.0 found in the denominators of the capability and performance indexes provides a reasonable estimate of the generic space needed by the process regardless of the shape of the histogram.3,4,5 The capability indexes use a within-subgroup estimator for dispersion, sigma(X). This allows the capability indexes to describe what the process is likely to deliver when it is operated up to its full potential. Thus, capability indexes describe the process potential. The performance indexes use a global standard deviation statistic, s. When multiplied by 6.0, this descriptive statistic defines an interval that will contain approximately 99 percent or more of the past data. Thus, the performance indexes can be said to characterize the past performance of the process.6 In consequence of these differences, any discrepancies between performance ratios and capability ratios will characterize the extent to which a process has fallen short of being operated up to its full potential. When a process is being operated on-target with minimum variance, all four indexes will be estimates of the same thing, and the four values will converge When a process is being operated off-center, the indexes on the right be smaller than those on the left. And when a process is being operated unpredictably, the indexes on the bottom will be smaller than those on the top. Thus, the overall gap between the capability ratio, Cp, and the centered performance ratio, Ppk, will capture the difference between the process potential and the actual process performance. As Ppk gets closer to Cp, the process is being operated closer to its full potential. Conversely, as Ppk drops relative to Cp, the opportunity for cost reduction increases. So, nothing in the formulas for capability and performance indexes makes any demand upon the shape of the histogram of your data. However, when we seek to convert a capability or performance index into a fraction nonconforming, we will have to invoke the blessing of some probability model. While the normal distribution is the generic distribution commonly used for these conversions, it should be abundantly clear that different probability models will convert a given index value into different estimates of the fraction nonconforming. While this would seem to make the question of the normality of the data important, it turns our to be a moot question. In next month’s column, I’ll explain why it is not a problem in practice. The computation of a capability or performance index does not depend upon the shape of the histogram. The multiplier of 6.0 is sufficiently generic to work with all types of data. The difference in the estimators of dispersion is not a matter of choice, but rather frames the way we interpret these indexes relative to each other. As these four indexes converge in value, the process is operating closer to its full potential (also known as on-target with minimum variance). As these four indexes diverge, they describe the extent and manner in which the process is being operated at less than its full potential. It is only when we seek to convert a capability or performance index into a fraction nonconforming that we have to use a probability model. Thus, probability models are not an inherent feature of capability and performance indexes, but are rather an assumption we impose to convert an index number into a fraction nonconforming. We will examine this conversion in next month’s column. References Quality Digest does not charge readers for its content. We believe that industry news is important for you to do your job, and Quality Digest supports businesses of all types. However, someone has to pay for this content. And that’s where advertising comes in. Most people consider ads a nuisance, but they do serve a useful function besides allowing media companies to stay afloat. They keep you aware of new products and services relevant to your industry. All ads in Quality Digest apply directly to products and services that most of our readers need. You won’t see automobile or health supplement ads. So please consider turning off your ad blocker for our site. Thanks, Find out about Dr. Wheeler’s virtual seminars for 2023 at www.spcpress.com. Dr. Wheeler is a fellow of both the American Statistical Association and the American Society for Quality who has taught more than 1,000 seminars in 17 countries on six continents. He welcomes your questions; you can contact him at djwheeler@spcpress.com. Does Capability Require Normality?
What is the link between the indexes and the models?
Capability indexes are statistics
Why do we use six sigma for the space required?
Figure 1: How six sigma(X) covers models of all shapesWhy do we use different estimates for dispersion?
Figure 2: How capability and performance indexes are relatedEstimating the fraction nonconforming
Summary
1. Wheeler, Don. “What are the Variance and Standard Deviation?” Quality Digest, Aug. 2, 2021.
2. Ibid. “Process Behavior Charts for Non-normal Data,” Quality Digest, Jan. 6, 2015.
3. Ibid. “Properties of Probability Models Part One,” Quality Digest, Aug. 3, 2015.
4. Ibid. “Properties of Probability Models Part Two,” Quality Digest, Sept. 1, 2015.
5. Ibid. “Properties of Probability Models Part Three,” Quality Digest, Oct. 5, 2015.
6. Ibid. “The Empirical Rule,” Quality Digest, March 5, 2018.
Our PROMISE: Quality Digest only displays static ads that never overlay or cover up content. They never get in your way. They are there for you to read, or not.
Quality Digest Discuss
About The Author
Donald J. Wheeler
© 2023 Quality Digest. Copyright on content held by Quality Digest or by individual authors. Contact Quality Digest for reprint information.
“Quality Digest" is a trademark owned by Quality Circle Institute, Inc.
Comments
Does Capability Require Normality?
Hi Don, I thought Cpk was describing process behaviour in the Control Chart) then placed in the Historgram with Specifications and the ratio to the closest Specirfication. AIAG SPC text may describe it better "It takes the process location as well as the capability into account. For bilateral tolerances Cpk will always be less than or equal to Cp. Cpk and Cp should always be evaluated and analyzed together. A Cp value significantly greater than the corresponding Cpk indicates an opportunity for improvement by centering the process." Is that same as what you said? "The centered capability ratio, Cpk, is an index number that uses twice the DNS to define the [effective space available within specifications] and then compares this with the [generic space required for any predictable process]."
Process Capability
The basic question: How likely are you to drop the next part close to or beyond the specification? It really helps to plot the dots and look at the distribution, not just do the math.