PROMISE: Our kitties will never sit on top of content. Please turn off your ad blocker for our site.
puuuuuuurrrrrrrrrrrr
Davis Balestracci
Published: Monday, April 7, 2014 - 15:52 To summarize my last three articles, most improvement approaches come out of the same theory and are based on the assumption that everything is a process.
The universal process flowchart in Figure 1 sums it up beautifully. The boxes at the top are how executives think the process works. The frontline’s frustrating reality is charted underneath and is how it really works, which is why it needs improvement. 
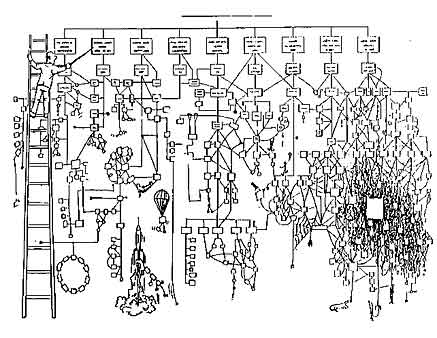
Figure 1: Universal process flowchart In my last article, “Finding the Unnecessary and Everyday Variation,” I challenged you to give serious consideration to “the current everyday use of data” as a process, one that needs improvement. So let’s apply a tool common to all approaches—a high-level flowchart (shown in figure 2). 
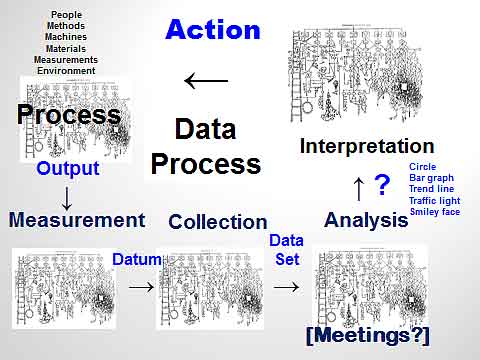
Figure 2: A high-level flowchart The current use of data has actually four processes: Each of these processes potentially has the six classic sources of process inputs: people, methods, machines, materials, measurements, and environments. Each process also has a “quality” associated with it and is subject to outside variation that can compromise this quality. Unless the variation in these processes is minimized, there is a danger of reacting to the variation in the data process and not the process one is trying to understand and improve. And what is the biggest danger? Human variation: in perceiving the variation being studied (objective), in the process of defining a literal number to collect (measurement), and in actually executing the “methods” of measurement, collection, analysis/display, and interpretation. Although measurement and collection are very important, the critical thinking needed to address them will be motivated by looking at any data’s routine current use. And most of this use takes place during scheduled meetings involving data. Aren’t many of these meetings scheduled because of undesirable variation? These include operational performances compared to goals, financial performances compared to budgets, comparisons using benchmarks, unforeseen incidents, and project progress, to name a few. The goal of these meetings is to reduce the gap (variation) between what is observed vs. what is desired with the hope of taking actions to drive the goal toward the latter. How are data typically used? Either raw data are handed out, and the meeting is analysis/display and interpretation, or (alleged) analyses and displays have been done beforehand, and the meeting is interpretation. The result of either is some type of action that becomes an input to the everyday work processes. What is the process by which a group of executives, managers, or workers looks at the data and any analyses/displays to take action? Don’t many currently favored displays have a danger of causing human variation in perceiving and interpreting variation? For example, in data tables, bar graphs, trend lines, percentile ranking, or variance (from goal), analysis people draw circles around numbers they “don’t like.” These result in people observing variation between a number on the page vs. what they “feel” it should be, but there is variation in how people perceive this variation and what people consider “too much.” Some people also see “trends,” but some don’t. There is lack of common theory for interpretation. Because of this, there is variation not only in how the people in the room perceive variation, but also in the recommended actions for closing the perceived undesirable gap. And this doesn’t even take into account additional potential variation: whether the data’s definition allows them to use it for this purpose or whether it was even collected appropriately. In other words, the meeting is pretty much using this analysis “tool”: Why is there lack of theory? Because all variation is considered special cause, needing only explanation from individual expertise to interpret, then take action. With everyone doing his or her best, recommended actions will come from individuals’ unique areas of expertise, resulting in more variation and argument... and “not enough time” to test proposed solutions. Somehow, someone’s wins. One needs theory to make the crucial distinction between whether the observed variation is due to special causes or common causes. Depending on the source, completely different approaches will be required to deal with it. How could you look at “the current use of data” and apply your improvement expertise? Look at a sample of any routine meeting’s raw data and objectively ask: Starting to feel uncomfortable? Good! Quality Digest does not charge readers for its content. We believe that industry news is important for you to do your job, and Quality Digest supports businesses of all types. However, someone has to pay for this content. And that’s where advertising comes in. Most people consider ads a nuisance, but they do serve a useful function besides allowing media companies to stay afloat. They keep you aware of new products and services relevant to your industry. All ads in Quality Digest apply directly to products and services that most of our readers need. You won’t see automobile or health supplement ads. So please consider turning off your ad blocker for our site. Thanks, Davis Balestracci is a past chair of ASQ’s statistics division. He has synthesized W. Edwards Deming’s philosophy as Deming intended—as an approach to leadership—in the second edition of Data Sanity (Medical Group Management Association, 2015), with a foreword by Donald Berwick, M.D. Shipped free or as an ebook, Data Sanity offers a new way of thinking using a common organizational language based in process and understanding variation (data sanity), applied to everyday data and management. It also integrates Balestracci’s 20 years of studying organizational psychology into an “improvement as built in” approach as opposed to most current “quality as bolt-on” programs. Balestracci would love to wake up your conferences with his dynamic style and entertaining insights into the places where process, statistics, organizational culture, and quality meet.The Universal Process Flowchart × 4
This tends to get a whole lot of emotional interpretation flowing
• Measurement
• Collection
• Analysis/display
• Interpretation
• What could these data tell you?
• What is actually being done with these data?
• What graphical displays are being used?
• What other displays are being used, e.g., traffic lights, rolling averages?
• What is the reliance on using tables of raw numbers?
• Is any difference between two numbers being treated as a special cause (e.g., smiley faces, “thumbs up or down,” month-to-month comparison, variance to goal)?
• What actions result from these data? Do they consider whether the variation being acted on is common or special cause?
• A key question/skill: Does a plot of these data over time exist? How could you construct one?
Our PROMISE: Quality Digest only displays static ads that never overlay or cover up content. They never get in your way. They are there for you to read, or not.
Quality Digest Discuss
About The Author
Davis Balestracci
© 2023 Quality Digest. Copyright on content held by Quality Digest or by individual authors. Contact Quality Digest for reprint information.
“Quality Digest" is a trademark owned by Quality Circle Institute, Inc.